
PerfectScale
Java Garbage Collection in Kubernetes: Choosing and Sizing the Right Collector
The JVM picks your garbage collector from pod limits, and a small CPU change can switch it. Here's how to choose, size, and verify it.
This page is also available in Deutsch, Español, Français, Italiano, 日本語, and Português.


TL;DR
- Default: G1 is the right starting collector for most Java services on Kubernetes.
- The cutoff: The JVM selects G1 only with 2 or more CPUs and at least 1792 MB of memory. Below that, it silently selects Serial.
- Set it explicitly: Pin the collector with a flag so a CPU or memory limit change cannot switch it.
- Pick by pod size: G1 for typical services, Parallel for batch, ZGC or Shenandoah for latency-sensitive services that have CPU and memory headroom.
- Memory: The heap is only part of the process. Leave headroom beyond
-Xmx, or the pod gets OOMKilled with a heap that is not full.
For most Java services on Kubernetes, G1 is the right garbage collector, and the JVM picks it for you only when the pod has at least 2 CPUs and about 1.75 GB of memory. Below that, the JVM silently falls back to the Serial collector. A small change to a CPU limit can therefore change how your service collects garbage, and nobody gets an alert when it happens.
This article explains what Java garbage collection does, how the JVM chooses a collector from your container limits, how G1, ZGC, Shenandoah, Parallel, and Serial differ, and which one to run at each pod size. It also shows how to read what your JVM is doing today, and how GC settings connect to OOMKilled pods and CPU throttling.
If your Java pods restart or throttle at startup, read JVM startup CPU throttling first. This article covers the steady-state side of the same problem.
Want to see it live? Join the hands-on workshop Java on K8s: The Startup vs. Steady-State Sizing Dilemma on October 28, 2026 at 11 AM ET.
What Is Java Garbage Collection?
Java garbage collection is the JVM's automatic process for finding objects that the application no longer uses and freeing their memory. The developer does not call free(). The collector does the work while the application runs.
Most collectors rely on the generational hypothesis: most objects die young. The heap is split into a young generation, where new objects start, and an old generation, where long-lived objects end up. A young collection is frequent and cheap. An old or full collection is rare and costly.
The cost shows up in two ways:
- Pause time. Some phases stop all application threads (a stop-the-world pause). Requests that arrive during a pause wait, which raises tail latency.
- CPU overhead. Collector threads compete with application threads for the same CPU.
In a container, both costs are bounded by limits you set in the pod spec. The CPU limit caps how much CPU the collector and the application share. The memory limit caps how large the heap, and everything else in the process, can grow. A collector that behaves well on a 16-core VM can behave very differently in a pod limited to 1 CPU.
How Does the JVM Pick a Garbage Collector in Kubernetes?
If you do not set a collector, the JVM chooses one at startup from two numbers: the CPU count it sees and the memory it sees. Oracle's HotSpot GC tuning guide calls a machine server-class when it has at least 2 processors and at least 1792 MB of memory. On a server-class machine the JVM selects G1. Otherwise it selects Serial.
In a container, the JVM reads those numbers from the cgroup, not from the node:
- CPU count comes from the CPU limit. The JVM divides the quota by the period and rounds up, so a limit of 1001m counts as 2 CPUs. Since JDK 19, it does not use the CPU request (
cpu.shares) for this count. - Memory comes from the memory limit. The default maximum heap is 1/4 of that memory, and the initial heap is 1/64.
That gives a simple outcome table:
| CPU limit | Memory limit | CPUs the JVM sees | Collector the JVM selects |
|---|---|---|---|
| 1 (or 500m) | 2Gi | 1 | Serial |
| 1100m | 2Gi | 2 | G1 |
| 2 | 1Gi | 2 | Serial (memory under 1792 MB) |
| 2 | 2Gi | 2 | G1 |
| No limit | Any | All CPUs on the node | G1 on a typical node, with many GC threads |
This is why a CPU limit of 1 and a limit of 1100m can behave differently even though the difference looks tiny. The JVM also sizes its GC worker threads from the CPU count, so the same pod spec can show different GC behavior on different limits. The effect is easy to miss: no event is raised, and the pod logs show nothing unless GC logging is on.
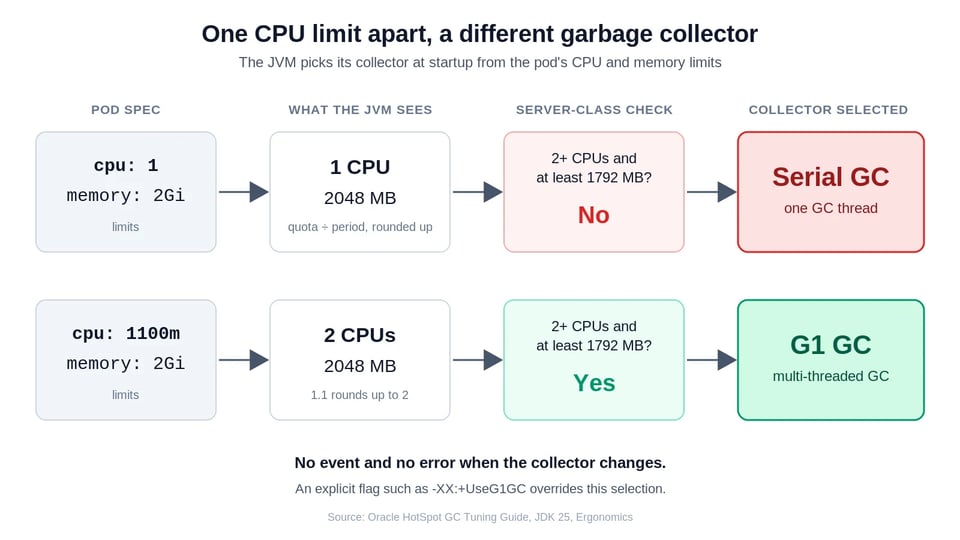
An explicit flag always wins. If you set -XX:+UseG1GC or -XX:+UseSerialGC, the JVM uses it regardless of the container size. A draft OpenJDK proposal (JEP draft 8359802) would make G1 the default even on small deployments. It is still a draft, so do not rely on it. Set the collector explicitly if you want the same behavior across JDK versions and pod sizes.
The CPU limit also affects how the collector runs. Concurrent GC threads share the container's CPU quota with your application threads. When the quota runs out, the kernel pauses all of them, including the collector. See Kubernetes CPU limits for how that quota works, and Kubernetes CPU throttling for how to detect it.
G1 vs ZGC vs Shenandoah vs Parallel vs Serial: How Do the Java Garbage Collectors Compare?
HotSpot ships five collectors you can pick with one flag. They trade throughput, pause time, and footprint against each other.
| Collector | Flag | How it works | Best fit | Watch out for |
|---|---|---|---|---|
| Serial | -XX:+UseSerialGC |
One GC thread, stop-the-world | Pods with 1 CPU and a small heap | Long pauses as the heap grows |
| Parallel | -XX:+UseParallelGC |
Multiple GC threads, stop-the-world | Batch jobs and throughput-first workloads | Pauses grow with heap size |
| G1 | -XX:+UseG1GC |
Region-based, mostly concurrent, targets a pause goal | Most services: the balanced default | Needs spare CPU for its concurrent threads |
| ZGC | -XX:+UseZGC |
Concurrent, generational since JDK 23, very low pauses | Latency-sensitive services with larger heaps | Higher CPU and memory cost than G1 |
| Shenandoah | -XX:+UseShenandoahGC |
Concurrent compaction, low pauses | Latency-sensitive services on OpenJDK builds that include it | Not in every vendor build; generational mode is a product feature only from JDK 25 |
Three version notes matter if you are choosing today:
- ZGC is generational by default since JDK 23 (JEP 474). JDK 24 removed the non-generational mode (JEP 490), so
-XX:+UseZGCnow always means generational ZGC. - Generational Shenandoah became a product feature in JDK 25 (JEP 521). Shenandoah still defaults to a single generation.
- G1 is the default on server-class machines, and has been since JDK 9.
The low-pause collectors do more work concurrently, so they use more CPU and memory to do it. In a pod with a tight CPU limit, that extra work competes with your application. This is the main reason ZGC and Shenandoah are usually a poor fit for small pods, and why you should measure before you switch.
Which Garbage Collector Should You Use for Your Pod?
Start from the pod size and the workload, then confirm with GC logs and latency numbers from your own service. These are starting points, not benchmarks.
| Pod and workload | Start with | Why |
|---|---|---|
| Under 2 CPUs or under about 1.75 GiB, small heap | Serial, or G1 with a deliberate choice | This is the range where the JVM selects Serial on its own. Set the flag explicitly so the choice is yours. |
| 2 or more CPUs, typical web or API service | G1 | Balanced throughput and pause time, and it is the JVM default for this size. |
| Batch, ETL, or offline processing where pauses do not matter | Parallel | Maximizes throughput when no user waits on a response. |
| Tail-latency-sensitive service with a larger heap and CPU headroom | ZGC, then Shenandoah if your JDK includes it | Concurrent collection keeps pauses low, at a CPU and memory cost. |
| CPU limit below the collector's needs | Raise the limit, or pick a lighter collector | A concurrent collector that is throttled can pause longer than G1 would. |
Two rules keep this practical. First, change one thing at a time: switching the collector and the heap size together hides which change helped. Second, decide with data. Compare p99 latency, GC time, CPU throttling, and memory working set before and after, under realistic load.
A collector change is also a sizing change. A low-pause collector can need more CPU and more memory than G1 for the same service, so a pod sized for G1 may need new requests and limits after the switch. For how requests and limits interact, see Kubernetes resource limits vs requests.
How Does Garbage Collection Relate to OOMKilled and Container Memory Limits?
GC works inside the heap. The container memory limit covers the whole process. The two failures look similar but have different causes:
| Failure | Who raises it | What it means | First fix |
|---|---|---|---|
java.lang.OutOfMemoryError: Java heap space |
The JVM | The heap hit -Xmx and GC could not free enough |
Find the leak or raise the heap |
| OOMKilled (exit code 137) | The kernel, via the cgroup | Total process memory crossed the container limit | Leave more room outside the heap, or raise the limit |
The heap is only part of what a JVM uses. The process also holds metaspace, thread stacks, the JIT code cache, direct buffers, and the collector's own native structures. Collectors differ in that last part, so switching collectors can move total memory even when -Xmx stays the same.
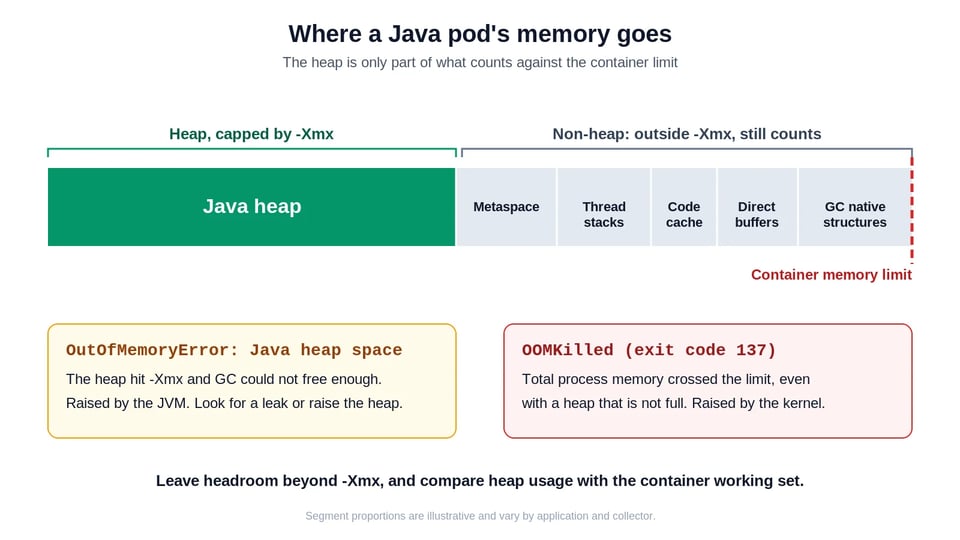
The default maximum heap is 1/4 of container memory, which often wastes memory. Many teams raise it with -XX:MaxRAMPercentage, commonly starting between 50 and 70 percent and adjusting from measured non-heap usage. Treat that range as a starting point: a service with many threads or heavy direct-buffer use needs more headroom.
For a fixed-heap approach (-Xms equal to -Xmx) and more container-aware JVM settings, see 5 Strategies to Optimize Java in 2026.
Two flags make failures easier to diagnose:
-XX:+ExitOnOutOfMemoryError-XX:+HeapDumpOnOutOfMemoryErrorThe first makes the JVM exit on a heap OOM so Kubernetes restarts the pod cleanly instead of leaving a half-working process. The second writes a heap dump you can inspect. Keep the dump path on a volume that survives the restart. For the Kubernetes side of this failure, see OOMKilled.
How Do You See What Your JVM Garbage Collector Is Doing?
Check three things: which collector is running, what GC costs you, and whether the container is throttled.
Which collector and CPU count the JVM chose
kubectl exec <pod-name> -- jcmd 1 VM.flags -all \ | grep -E 'UseSerialGC|UseG1GC|UseZGC|UseParallelGC|ParallelGCThreads|ConcGCThreads'This needs jcmd in the image and the JVM running as process 1. A JRE-only image does not include jcmd.
GC logs
Turn on unified GC logging with an environment variable, and read the pause lines:
env: - name: JAVA_TOOL_OPTIONS value: "-Xlog:gc*:stdout:time,uptime"Look for how often young collections run, how long the pauses are, and whether full collections appear. Frequent full collections mean the heap is too small for the live data.
Metrics worth alerting on
If you use Micrometer or the Prometheus JMX exporter, these show GC cost over time:
| Signal | Example metric | What a bad value looks like |
|---|---|---|
| GC pause time | jvm_gc_pause_seconds_sum |
Rising share of wall-clock time in GC |
| Heap in use | jvm_memory_used_bytes{area="heap"} |
Stays near the max after collections |
| Container memory | container_memory_working_set_bytes |
Approaches the memory limit |
| CPU throttling | container_cpu_cfs_throttled_periods_total over container_cpu_cfs_periods_total |
A high share of throttled periods while GC runs |
Read the heap and container memory lines together. Heap well below the limit with the working set near the limit points to non-heap memory, not the collector. A high throttled share during GC points to a CPU limit that is too tight for the collector you chose.
GC and CPU pressure often peak in the first seconds after a pod starts, then disappear from five-minute dashboards. To catch them, see how to detect Kubernetes startup spikes.
Which JVM Flags Make Garbage Collection Container-Aware?
The JVM reads container limits by default (-XX:+UseContainerSupport). These flags make the result explicit and repeatable:
| Flag | What it does | When to set it |
|---|---|---|
-XX:+UseG1GC (or another collector) |
Fixes the collector | Always, so pod size changes do not switch it |
-XX:MaxRAMPercentage=<n> |
Sets the maximum heap as a share of container memory | When the 25% default leaves memory unused |
-XX:ActiveProcessorCount=<n> |
Overrides the detected CPU count | When you want the same thread counts in every environment |
-XX:ParallelGCThreads=<n> |
Sets stop-the-world GC worker threads | When the CPU-derived default is too high for a throttled pod |
-XX:ConcGCThreads=<n> |
Sets concurrent GC worker threads | When concurrent GC competes with the application for CPU |
-XX:MaxGCPauseMillis=<n> |
Sets a pause-time goal for G1 | Only after you have measured pauses |
-Xlog:gc* |
Turns on GC logging | Always in production |
A starting set for a typical API pod with 2 CPUs and 2 GiB of memory looks like this:
env: - name: JAVA_TOOL_OPTIONS value: >- -XX:+UseG1GC -XX:MaxRAMPercentage=65 -XX:+ExitOnOutOfMemoryError -Xlog:gc*:stdout:time,uptimeThe value 65 is a starting point, not a recommendation for every service. Measure the non-heap footprint first, then adjust. Avoid copying large sets of tuning flags from old blog posts. Defaults have changed across JDK versions, and extra flags often make GC behavior harder to reason about.
How PerfectScale Helps Right-Size Java Workloads
GC settings, heap size, and pod requests and limits all affect each other. Changing one without the others is how teams end up with throttled pods or OOMKilled restarts. PerfectScale shows these signals together.
For Java containers, PerfectScale collects heap, non-heap, and garbage collection data. It shows GC time, the active processor count, and the GC type, so you can see which collector each workload runs and what it costs. You can turn on JVM metrics collection when you install the PerfectScale agent. It supports Linux nodes only.
PerfectScale also respects your JVM settings. When you set a maximum or minimum heap size, PerfectScale does not apply a recommendation that goes outside it. To resize pods without restarts, see in-place right-sizing and the Vertical Pod Autoscaler.

Workshop: Java on K8s: The Startup vs. Steady-State Sizing Dilemma. Vikram Seshadri from DoiT walks through the JVM boot spike, what it costs in throttling, OOM kills, and over-provisioned requests, and how to size pods for steady state with an in-place resize and no restart. October 28, 2026 at 11 AM ET. Save your seat.
Do you want to see how PerfectScale right-sizes your Java workloads? Start for free or book a demo.
FAQ
What is the default garbage collector in Java? G1 on a server-class machine, which means 2 or more processors and at least 1792 MB of memory. Otherwise the JVM selects Serial. In a container, the JVM reads the CPU limit and memory limit to decide.
Which garbage collector is best in Java? No collector wins everywhere. G1 is the best starting point for most services. Parallel suits batch work, and ZGC or Shenandoah suit latency-sensitive services that have CPU and memory headroom.
Does Java do automatic garbage collection? Yes. The JVM finds unused objects and frees their memory without developer calls. You tune it with the collector choice, heap size, and GC flags.
How does garbage collection work in Java? The collector finds objects that the application can no longer reach, frees their memory, and often compacts what remains. Most collectors split the heap into young and old generations because most objects die young.
Is ZGC better than G1? ZGC targets lower pauses, and it pays for that with more CPU and memory. It tends to help most on larger heaps with spare CPU. On small pods, G1 is usually the safer choice. Test with your own traffic.
Why does my Java pod get OOMKilled when the heap is not full?
The container limit covers metaspace, thread stacks, the code cache, direct buffers, and collector structures as well as the heap. Leave headroom beyond -Xmx, and compare heap usage with the container working set.
Does a CPU limit affect Java garbage collection? Yes, in two ways. The limit sets the CPU count that the JVM uses to size GC threads and, together with memory, to pick the collector. It also caps the CPU that GC threads and application threads share, so throttling pauses both.
Related reading
- 5 Strategies to Optimize Java in 2026: container-aware heap, CPU, and GC settings
- JVM startup CPU throttling: why the JVM needs the most CPU in its first seconds
- Detect Kubernetes startup spikes: find the throttling and OOM kills that dashboards hide
- Fix Kubernetes resource policies that optimize for the wrong phase: quotas and LimitRanges for startup vs steady state
- How to fix OOMKilled in Kubernetes
- Kubernetes CPU throttling
- Kubernetes CPU limits
- Kubernetes resource limits vs requests
- We can resize pods without restarts! Or can't we?
- Kubernetes Vertical Pod Autoscaler (VPA)
- Kubernetes Horizontal Pod Autoscaler (HPA)