


Kubernetes CPU throttling happens when a container hits its CPU limit and the Linux kernel slows it down instead of killing it. The container is paused for short periods of time, so it runs slower than it wants to. The confusing part is that this can happen while your dashboards show the pod using very little CPU on average, which is what makes throttling one of the harder performance problems to diagnose.
In this guide, you'll learn what CPU throttling is, how CPU requests and limits work, how the Linux CFS scheduler enforces CPU limits, how throttling affects application performance, what commonly causes it, how to detect it, and how to fix it.
What is Kubernetes CPU throttling?
CPU throttling happens when a container tries to use more CPU than its configured limit allows. The Linux kernel restricts the container from using more CPU once it reaches its available quota for the current period. Unlike memory, where exceeding the limit can cause the container to be killed, exceeding a CPU limit generally slows the container down rather than terminating it.
The important thing to understand is that throttling is enforced over short CPU periods, so it may not show up clearly in the average CPU numbers most dashboards display. A pod can look nearly idle over a one-minute average and still experience frequent CPU throttling. That gap between what your metrics show and what your application experiences is one reason CPU throttling can be difficult to detect.
How do CPU requests and limits work in Kubernetes?
Kubernetes CPU throttling is caused by CPU limits, so it is useful to first understand the difference between requests and limits.
A CPU request is what the container needs to be scheduled. The scheduler uses it to find a node with enough free CPU and reserves that amount for the pod. Under the hood, a request becomes a CPU share (or weight, in cgroup v2), which decides how CPU is divided when several containers compete for a busy node. A request never causes throttling. It only guarantees the container its fair share when the node is under contention.
A CPU limit is a hard cap on how much CPU time the container can use, and it is the thing that causes throttling. The container runtime turns the limit into a CFS quota, and once the container uses that quota, the kernel throttles it. So requests are about scheduling and fair sharing, while limits are about capping, and only the cap throttles.
resources: requests: cpu: 250m limits: cpu: "1"How you set requests and limits also decides the pod's Quality of Service (QoS) class, which Kubernetes uses when it has to evict pods under node pressure. A pod is Guaranteed when every container has CPU and memory requests equal to its limits, Burstable when requests are set but lower than the limits, and BestEffort when no requests or limits are set at all. QoS mainly affects eviction order, but Guaranteed pods with whole-number CPU limits can also get dedicated cores, which comes up later as a way to avoid throttling.
How the Linux CFS scheduler enforces CPU limits?
The kernel enforces CPU limits with the Completely Fair Scheduler (CFS), and understanding its model explains almost every throttling case. CFS works in repeating periods, and the period is 100 milliseconds by default (cpu.cfs_period_us). Your CPU limit is turned into a quota of CPU time per period. A limit of 500m gives the container 50ms of CPU time every 100ms, and a limit of 2 gives it 200ms every 100ms, since work can run on two cores at once. When the container uses up its quota before the period ends, the kernel throttles it, pausing every thread in the container until the next period begins, even if the node has idle CPU to spare.
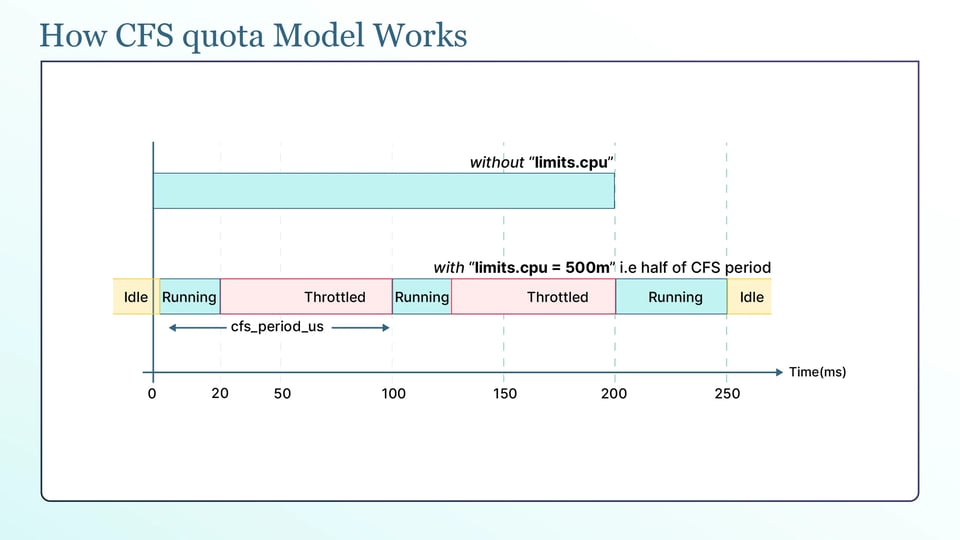
This is why multi-threaded applications get throttled sooner than people expect. A container with a limit of 2 and, say, ten busy threads can burn its 200ms of quota in the first 20ms of the period by running all ten threads across ten cores at once. All of them are then paused for the remaining 80ms. The Average CPU usage may look normal, while the application experiences repeated slowdowns.
Where the limit is stored depends on the cgroup version. In cgroup v1, the values live in cpu.cfs_period_us and cpu.cfs_quota_us. In cgroup v2, they are combined into one file, cpu.max, written as quota and period together. Most clusters today use cgroup v2, which has been the default since Kubernetes 1.25 and on modern Linux distributions.
One more important thing to know is that for years, the Linux kernel had a CFS quota bug where unused quota from one core expired instead of being reused, so heavily threaded applications were throttled even when they were using well under their limit. This phantom throttling was fixed in kernel 5.4 and backported to the 4.19 stable series. If you still see heavy throttling on well-configured workloads, check the node's kernel version, because a very old kernel can be the cause.
What CPU throttling does to application performance?
Throttling is hard to notice. It usually appears in three ways:
a. The first is tail latency, which means the slowest requests take longer than usual. When a container is throttled, some requests must wait for CPU time before they can be processed. This can increase p99 latency, even when the average CPU usage looks low. The result is slow responses even with a calm-looking CPU graph.
Diagram 2 - "Low average, still throttled."
b. The second is probe failures. A throttled container can be too slow to answer its liveness or readiness probe in time, so Kubernetes marks it unhealthy and restarts it. The restart looks like a crash, but the real cause is that the container could not get CPU when the probe arrived.
c. The third is slow startup. JVM and Go applications often do CPU-heavy work at startup, such as JIT compilation or warming caches. A tight CPU limit throttles exactly this phase, so the container takes much longer to become ready, which can then cause the startup or readiness probe to fail as well.
Common causes of CPU throttling in Kubernetes clusters
Most CPU throttling problems come from the following causes:
a. CPU limits set too close to peak usage: If a limit is only slightly higher than what a container needs during normal peaks, short CPU spikes can hit the limit and cause throttling. Limits that were set months ago based on older usage are a common example.
b. Runtimes that size thread pools from node cores instead of the container limit: Many language runtimes historically counted the node's CPU cores, not the container's limit, and created far more worker threads than the container was allowed to run. A runtime on a 64-core node with a 2 CPU limit might start dozens of threads, burn the quota almost instantly, and throttle for the rest of every period. Go versions before 1.25 and older JVMs worked this way, using GOMAXPROCS and the JVM's ActiveProcessorCount settings.
c. Sidecar and init containers competing for CPU: Every container in a pod has its own limit, but they share the node, and a busy sidecar such as a logging or mesh proxy can compete with the main container. If their limits are set without accounting for each other, one can be throttled while the other runs.
d. Node overcommitment and noisy neighbors: Kubernetes allows the total CPU limits of all containers on a node to be higher than the node's actual CPU capacity. This works when workloads use CPU at different times. However, if several workloads become busy at the same time, or a noisy neighbor uses too much CPU, the node can become overloaded. This increases CPU contention and can slow down containers, even if they have not reached their own CPU limits.
How to detect CPU throttling?
You cannot see throttling with kubectl top, which only shows CPU usage. You need the kernel's throttle counters, and there are two that matter.
container_cpu_cfs_periods_total is the total number of CFS periods the container has run through, and container_cpu_cfs_throttled_periods_total is how many of those periods it was throttled in.
A third, container_cpu_cfs_throttled_seconds_total, tells you the total time spent throttled. These come from the kubelet through cAdvisor, and the raw counters are also readable in the container's cpu.stat file.
The number to watch is the throttle percentage, which is the throttled periods divided by total periods. In PromQL:
rate(container_cpu_cfs_throttled_periods_total[5m]) / rate(container_cpu_cfs_periods_total[5m]) * 100Put this on a Grafana dashboard per container, and alert when it stays high. For a latency-sensitive service, even a few percent of periods throttled is enough to hurt p99, so an alert threshold in the low single digits is reasonable. Batch workloads can tolerate much more.
Throttling also quietly affects autoscaling. The Horizontal Pod Autoscaler scales on CPU utilization, which is usage against the request. When a container is throttled, its usage is capped at its limit, so the number the HPA reads no longer reflects the real demand. The result is that the HPA can scale at the wrong time or by the wrong amount, which is another reason to fix throttling rather than scale around it.
How to fix Kubernetes CPU throttling?
The right fix depends on the workload. Here are the most useful approaches:
a. Raise the CPU limit, or remove it, and decide per workload: If a container genuinely needs more CPU than its limit, raise the limit to cover its actual peak. For latency-sensitive services, many teams remove the CPU limit entirely, since a container with no limit has no quota to exhaust and cannot be throttled, while its request still guarantees a fair share. You have to keep limits where you need predictable, repeatable behavior, such as in testing, and consider removing them where latency matters most.
b. Right-size requests and limits from observed usage percentiles: Do not guess. You should look at the container's real usage over time and size the request around its typical usage and the limit around its peak, using P95 or P99 rather than the average, so normal spikes do not get throttled.
c. Resize CPU on running pods with in-place pod resize: In-place pod resize is GA as of Kubernetes 1.35, so you can change a running container's CPU request and limit without recreating the pod. You do it through the pod's resize subresource, and CPU changes apply without a restart. This makes fixing a throttled workload far less disruptive than the old delete-and-recreate.
kubectl patch pod <name> --subresource resize --patch \ '{"spec":{"containers":[{"name":"app","resources":{"limits":{"cpu":"1"}}}]}}'d. Enable CFS burst to absorb short spikes: The CFS burst is a Linux kernel feature (kernel 5.14 and later, on cgroup v2) that lets a container build up unused quota and spend it during a short spike, briefly going above its limit without raising the limit permanently. It fits workloads that are throttled by brief bursts rather than sustained load. Be aware that Kubernetes does not expose this natively yet, so you enable it either by setting cpu.max.burst on the cgroup directly or through a tool such as Koordinator that sets it from a pod annotation.
e. Pin cores with the CPU Manager static policy for latency-critical pods: For pods that are both CPU-heavy and latency-sensitive, the kubelet's static CPU Manager policy (--cpu-manager-policy=static) gives a Guaranteed pod with a whole-number CPU limit its own dedicated cores. The pod then runs on those cores without competing for CPU time, which avoids CFS throttling for that workload. The trade-off is that the cores are reserved even when the pod is idle, so use it only where consistent low latency is worth it.
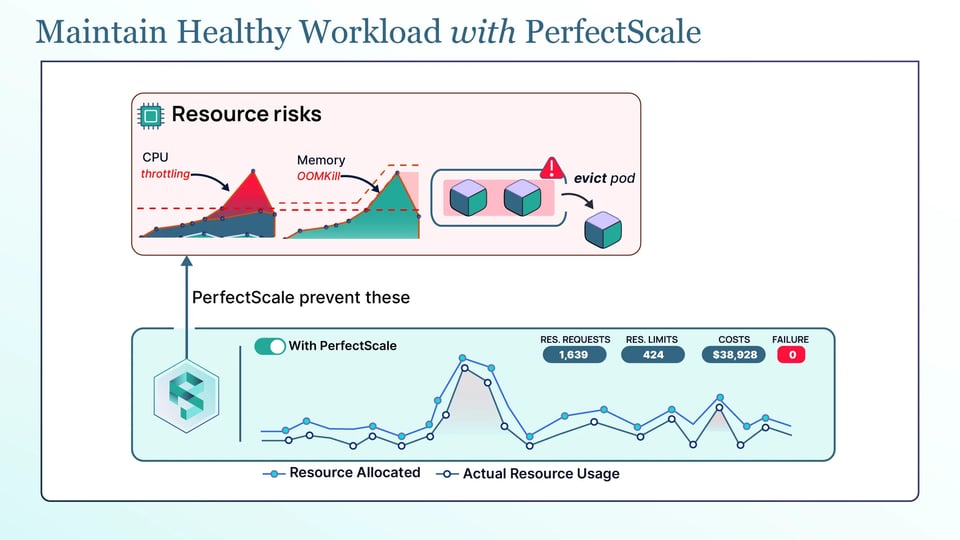
f. Automate continuous right-sizing instead of tuning by hand: CPU Usage changes over time, so a limit that was right last quarter can start throttling today. Instead of re-checking cpu.stat by hand, automate it. This is where PerfectScale helps: its Kubernetes governance platform watches how your workloads actually use CPU and memory, along with throttling signals, and turns that into actionable, automated right-sizing recommendations for requests and limits that you can apply manually or autonomously. Your pods stay sized to what they really need, without throttling and without over-provisioning. Teams like Paramount Pictures and Creditas use PerfectScale to keep their clusters efficient, and you can give it a try or book a technical session.
Kubernetes CPU throttling best practices
The following are the best practices you should follow:
a. Always set CPU requests, and treat CPU limits as optional: The request is what protects your workload because it guarantees CPU and places the pod well. So, set it on every container and decide on limits case by case rather than adding them by default.
b. Keep CPU limits within a small multiple of requests: When you do use a limit, do not set it far above the request, which hides real demand, or right at the request, which throttles on any spike. A small multiple above the request leaves room for normal bursts.
c. Align application concurrency with the container CPU limit: you have to make the runtime aware of its limit so it does not size thread pools based on the node's cores. In Go 1.25 and later, the runtime automatically reads the container's CPU limit. Java 11 and later uses UseContainerSupport, while other runtimes may require the thread count to be configured manually. This can reduce throttling for many workloads.
d. Apply different limit policies to latency-sensitive and batch workloads: They have opposite needs. Latency-sensitive services benefit from loose limits or no limit, so they are never throttled mid-request, while batch jobs can run with firm limits because a bit of throttling only makes them take longer.
e. Scale horizontally on right-sized requests rather than inflating limits: When a workload needs more capacity, add replicas based on accurate CPU requests rather than simply increasing the CPU limit. This spreads the workload across pods and gives the HPA a more useful CPU utilization signal.