
PerfectScale
Your JVM Service Needs 2 CPUs for 30 Seconds and 0.3 CPUs Forever
A JVM needs the most CPU in its first seconds. Learn how Kubernetes CPU limits throttle JVM startup, how to measure it, and how to size your pods.
This page is also available in Deutsch, Español, Français, Italiano, 日本語, and Português.


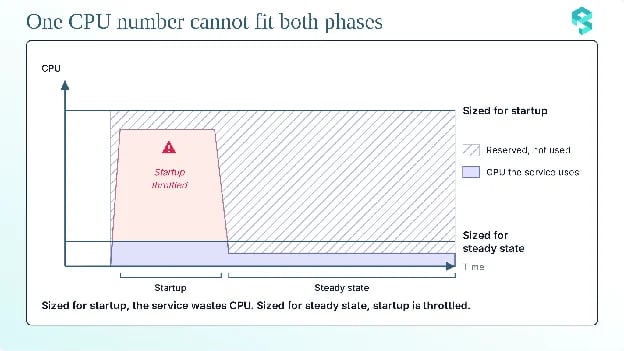
A Java service needs the most CPU in its first seconds. The JVM loads classes, compiles code, and builds the application. After that, the service needs much less CPU. In most clusters, a pod keeps the same CPU request and the same CPU limit for its whole life. The pod therefore cannot follow this pattern.
This mismatch causes Kubernetes CPU throttling during JVM startup. If the limit is low, the JVM cannot finish its startup work quickly, and the pod becomes Ready late. If the request is high, the node reserves CPU that the service does not use after startup. Neither setting fits both phases.
The numbers in the title are an example. Your own service has its own numbers, and this article shows you how to check what your service does. The article explains why startup needs more CPU, how Kubernetes enforces CPU settings, and what the JVM decides from those settings. At the end, you will find the options that you have today.

Why Java Startup Needs More CPU Than Steady State?
Before a JVM serves its first request, it must finish a large amount of work. This work has four main parts:
Class loading and linking
The JVM loads a class when the code first needs it. It reads the class file, checks it, and links it. A Spring application needs a large number of classes in the first seconds, because the framework scans the application and creates its beans.
JIT compilation with C1 and C2
The JVM starts by interpreting bytecode, which is slow. It counts how often each method runs. HotSpot then compiles the busy methods to machine code with two compilers. C1 compiles fast and produces simple code. C2 compiles more slowly and produces faster code for the busiest methods. This design is called tiered compilation. The compilers run on their own threads, and the JVM chooses the default number of these threads from the CPU count.
Garbage collection threads and heap growth
Startup allocates many objects. The heap grows, and the collector runs to free memory. The JVM chooses the collector and its number of threads from the CPU count and the memory size.
Framework initialization
The framework builds beans, creates proxies, reads configuration, and opens connections. Spring Boot Actuator can list each of these steps in its startup endpoint when you use BufferingApplicationStartup, which helps you see where the time goes.
Each part has an end. After the classes are loaded, the busy methods are compiled, and the beans exist, the demand for CPU falls. The fall is not instant, because the JIT compilers keep compiling methods as real traffic arrives. Still, the steady state needs far less CPU than startup. The gap between the two phases is the reason why one CPU setting cannot fit both.
How Kubernetes Applies CPU Requests and Limits?
Kubernetes controls the CPU of a container with two settings:
CPU requests and scheduling
The CPU request is the amount of CPU that Kubernetes reserves for a container. The scheduler adds up the requests of the pods on each node, and it places a new pod only on a node with enough unreserved CPU. The request also sets the CPU share on a busy node. When containers compete for CPU, the kernel gives more CPU time to a container with a larger request. On cgroup v2, the container runtime writes the request as cpu.weight. On cgroup v1, it uses cpu.shares.
If you set a limit and no request, Kubernetes uses the limit as the request. The request and limit also decide the QoS class of the pod. A pod is Guaranteed when every container has the same value for its CPU request and CPU limit, and the same value for its memory request and memory limit. It is Burstable when it has some requests or limits but does not meet the Guaranteed rule. It is BestEffort when it has none.
CPU limits and throttling
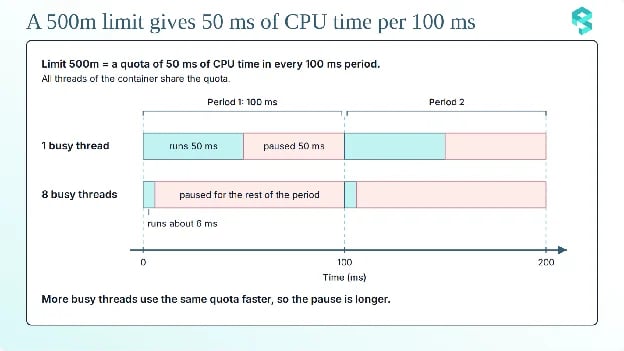
The CPU limit is a hard cap, and the kernel enforces it with throttling. The kernel divides time into periods, and the kubelet uses a period of 100 ms by default. In each period, the container may use a quota of CPU time. The limit sets the size of the quota. The runtime writes the limit as cpu.max on cgroup v2. A limit of 500m becomes 50000 100000, which is a quota of 50,000 microseconds in each period of 100,000 microseconds.
resources: requests: cpu: 300m # reserves CPU and sets the CPU share on a busy node memory: 2Gi limits: cpu: "1" # hard cap: written as 100000 100000 in cpu.max memory: 2GiWhat Is Kubernetes CPU Throttling?
Throttling is the way the kernel enforces a CPU limit. When the threads of a container use the whole quota of a period, the kernel pauses all of them until the next period begins.
The threads share one quota, and this detail matters for a JVM. Take a limit of 500m, which gives 50 ms of CPU time in each period. One busy thread needs 50 ms to use the quota, so it runs for half of the period. Eight busy threads use the same quota in about 6 ms, and then the kernel pauses all eight for the rest of the period. A JVM at startup runs many busy threads at the same time, so it reaches its quota early in every period.
Kubernetes does not stop a container for using too much CPU. It slows the container down. Kubernetes does not report throttling as an event, and the container logs show no error. The damage appears as delay, and you find it only when you measure it.
CPU Throttling During JVM Startup
Much of JVM startup is CPU-bound work. The JVM has a fixed amount of work to finish before the application can serve traffic, and the limit sets how fast the container can do that work. A higher limit finishes the work sooner. A lower limit stretches the same work over more periods, and the container waits in every period after it uses its quota. Throttling during startup causes two problems:
Slow startup and late readiness
A throttled JVM takes longer to start, so the pod becomes Ready later. This delay has costs outside the pod. A rolling update waits for each new pod to become Ready, so every rollout takes longer. New replicas help only after they become Ready, so scale-out is slower when traffic grows. During a node failure, the replacement pods also need the same extra time.
Failed probes and restarts
A startup probe tells the kubelet when the application has started. While the startup probe runs, Kubernetes does not run the liveness and readiness probes. If the startup probe does not succeed within failureThreshold × periodSeconds, the kubelet restarts the container. You should use a startup probe for a container that needs a long time to start, and point it at the same endpoint as the liveness probe.
Without a startup probe, a slow start can cause a restart loop. The liveness probe fails while the JVM is still starting, the kubelet restarts the container, and the new container repeats the same CPU work. A throttled JVM makes this loop more likely, because its startup takes longer.
A startup probe with a wide window prevents the loop:
startupProbe: httpGet: path: /actuator/health/liveness port: 8080 periodSeconds: 5 failureThreshold: 24 # waits up to 24 x 5 = 120 secondsA wide window stops the restarts, but it does not make startup faster. The pod still becomes Ready late.
How to Measure Throttling?
Two cAdvisor counters show throttling. The counter container_cpu_cfs_periods_total counts all periods. The counter container_cpu_cfs_throttled_periods_total counts the periods in which the container used its whole quota. Divide the second counter by the first to get the share of throttled periods.
sum(rate(container_cpu_cfs_throttled_periods_total{container="app"}[5m]))/sum(rate(container_cpu_cfs_periods_total{container="app"}[5m]))A five-minute rate hides a startup that lasts only a few seconds. For startup, read the raw counters when the pod becomes Ready, and divide them yourself. On cgroup v2, the container also exposes the same data in cpu.stat. The fields nr_periods, nr_throttled, and throttled_usec show the number of periods, the number of throttled periods, and the total throttled time.
kubectl exec <pod-name> -- cat /sys/fs/cgroup/cpu.statYou can also read the cAdvisor values from the kubelet:
kubectl get --raw /api/v1/nodes/<node-name>/proxy/metrics/cadvisor | grep container_cpu_cfsRemember the sampling interval. The metric system updates its values only at a fixed interval. A startup peak that is shorter than this interval looks smaller than it is, or it does not appear at all. For short peaks, sample the raw counters more often.
How the CPU Limit Changes JVM Behavior?
The CPU limit does more than slow the JVM. On Linux, the JVM supports containers by default (-XX:+UseContainerSupport). It reads the limit when it starts. These three points show how that value changes what the JVM does:
Active processor count from CPU limits
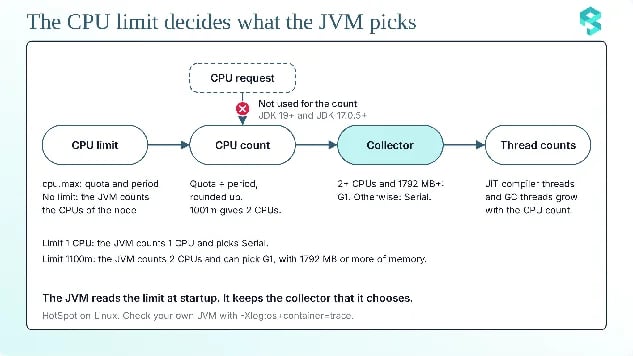
The JVM divides the CPU quota by the period and rounds the result up to the next whole number. A limit of 1001m therefore gives 2 CPUs. JDK 19 and later, and JDK 17.0.5 and later, do not use the CPU request (cpu.shares) to count CPUs. Many JVM settings depend on this count, including the number of JIT compiler threads and the number of GC threads.
Garbage collector selection (Serial vs. G1)
The JVM treats a machine as server-class when it has at least 2 processors and at least 1792 MB of memory. On a server-class machine, the JVM selects G1. Otherwise, it selects the Serial collector. A small change in the limit can therefore change the collector. A limit of 1 CPU gives one processor, so the JVM selects Serial. A limit of 1100m gives two processors, so the JVM selects G1 when the memory is at least 1792 MB. The two collectors behave differently at startup. G1 starts several worker threads that run in parallel, so it can use more CPU at once. Serial collects with one thread.
Pods without CPU limits
Without a limit, the JVM counts the CPUs of the node. On a large node, it sees many CPUs and starts many compiler and GC threads. The pod then has no throttling, but it can use a large amount of CPU in total, and it competes with its neighbors in proportion to its request. A small request gives this pod a small share when the node is busy.
You can check the choices of your own JVM. Enable the container log, and read the flags of the running JVM:
env: - name: JAVA_TOOL_OPTIONS value: "-Xlog:os+container=trace -Xlog:gc*"kubectl exec <pod-name> -- jcmd 1 VM.flags -all \ | grep -E 'UseSerialGC|UseG1GC|ParallelGCThreads|CICompilerCount'Note: The command needs jcmd in the image, and it expects the JVM to run as process 1. If a shell starts the JVM, use the real process ID of the JVM. A JRE-only image does not include jcmd.
The flag -XX:ActiveProcessorCount=<n> overrides the detected CPU count. Use it when you want the same JVM behavior in every environment.
Why No Single CPU Request Is Safe?
Each way to set the request has a cost. These are the four choices:
Sizing for startup
A high request and limit give the JVM enough CPU to start fast. But the node reserves the high request for the whole life of the pod, and other pods cannot use that CPU. After startup, the service uses only a small part of the reservation. Over many replicas and many nodes, this unused CPU becomes a large cost.
Sizing for steady state
A small request and limit fit the service after startup. But the JVM now has too little CPU for its startup work. The kernel throttles it, the pod becomes Ready late, probes can fail, and rollouts take longer. The service is cheap but fragile.
Removing the CPU limit
Without a limit, the kernel does not throttle the container, and startup can use any free CPU on the node. This choice has trade-offs. The JVM sizes its threads for all CPUs of the node. On a busy node, the container gets CPU time only in proportion to its request, so a small request can still slow startup. Also, without a limit, one pod can take CPU that its neighbors need.
HPA and the CPU initialization period
The Horizontal Pod Autoscaler (HPA) measures CPU use as a percentage of the request. A small request makes the startup peak look like very high load, and the HPA can add replicas that the service does not need. Kubernetes reduces this risk, because the HPA might skip CPU samples for a new pod. By default, the readiness delay is 30 seconds (--horizontal-pod-autoscaler-initial-readiness-delay), and the CPU initialization period is 5 minutes (--horizontal-pod-autoscaler-cpu-initialization-period). Both flags belong to kube-controller-manager, so on a managed cluster you may not be able to change them.
Ways to Handle Startup CPU Today
Here are the ways you can handle startup CPU:
Reduce startup work
Less work means a shorter startup at any limit. Spring Boot can create beans on first use with spring.main.lazy-initialization=true. Class Data Sharing and the AOT cache can remove part of the class loading work. The AOT cache arrived in JDK 24 (JEP 483). Spring Framework supports both CDS and the AOT cache. Profiling shows where your own startup time goes.
Set the CPU limit above the startup need
Keep the request near the steady-state level, and set the limit high enough for startup. The pod then has the Burstable QoS class. The scheduler reserves only the request, and the pod can use CPU up to the limit when the node has free CPU. At startup, the node might not have free CPU, so this option helps most on nodes with spare capacity. A higher limit also changes the CPU count that the JVM sees.
In-place pod resize
In-place pod resize changes the CPU and memory of a running pod without a restart. The feature reached beta in Kubernetes 1.33 and became stable in Kubernetes 1.35. With this feature, a pod can start with a high CPU limit and move to a lower one after startup. A container controls the behavior with a resize policy. The default policy for CPU is NotRequired, and you can state it in the manifest:
containers: - name: app resizePolicy: - resourceName: cpu restartPolicy: NotRequiredYou change the resources through the resize subresource. This command needs kubectl 1.32 or later:
kubectl patch pod <pod-name> --subresource resize --patch \ '{"spec":{"containers":[{"name":"app","resources":{"requests":{"cpu":"300m"},"limits":{"cpu":"500m"}}}]}}'The field status.containerStatuses[].resources shows the resources that the container uses now. Some pods cannot use in-place resize. Windows pods and pods under the static CPU or Memory manager policy are examples. A resize also cannot change the QoS class of the pod. Someone must also trigger the resize. A person can run the patch by hand, but for many pods a controller must run it.
A resize changes the cgroup limit, but the JVM chooses some settings only once. It selects the collector at startup and keeps it. Settings that depend on the CPU count, such as the maximum number of GC threads, are also set at startup. Runtime.availableProcessors() can change while the JVM runs, so code that reads the CPU count at runtime can see the new value. Test a resize on your own JDK before you rely on it.
JVM memory caveat
Do not lower the memory limit of a JVM container. The JVM sets its maximum heap at startup. By default, the maximum heap is 25% of the container memory (-XX:MaxRAMPercentage). The JVM also uses memory outside the heap, such as metaspace, thread stacks, and the code cache. A memory limit below the real use of the process causes an OOM kill. For this reason, resize the CPU after startup, and raise the memory limit only when needed.
VPA and managed startup boost options
The Vertical Pod Autoscaler (VPA) has an InPlaceOrRecreate update mode. This mode tries an in-place resize first, and it recreates the pod when an in-place resize is not possible. On GKE, the CPU startup boost works with the VPA. It raises the CPU request when the pod is created, and it keeps the higher request for durationSeconds after the pod becomes Ready. Then GKE returns the request to its baseline value in place. The boost applies only when the pod is created, so a container restart inside the same pod gets no boost.
The feature is in Preview at the time of writing, and it needs GKE 1.36.0-gke.4447000 or later.
apiVersion: autoscaling.k8s.io/v1kind: VerticalPodAutoscalermetadata: name: example-vpaspec: targetRef: apiVersion: apps/v1 kind: Deployment name: example updatePolicy: updateMode: "Off" startupBoost: cpu: type: "Factor" factor: 2 durationSeconds: 10In this example, the boost doubles the CPU request (factor: 2) and keeps it for 10 seconds after the pod becomes Ready. With updateMode set to Off, the VPA applies only the boost and makes no other changes. If you use an HPA with the boost, define a readiness probe and set durationSeconds to 0. This stops the HPA from adding replicas because of the CPU peak at startup.
PerfectScale dual-phase automation
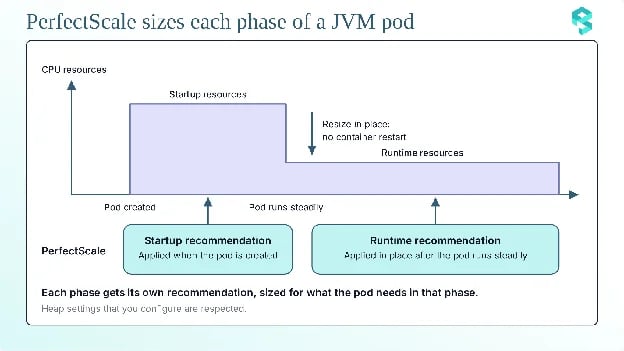
A JVM service has two resource needs. At startup, the JVM loads classes, compiles code, and builds the application, so the service needs a lot of CPU. After that, it needs much less. One average recommendation does not work for both phases. PerfectScale provides two recommendations for each workload: one for startup and one for steady-state runtime. PerfectScale sizes the startup recommendation to the higher need of the two phases, so the node has enough capacity during startup.
PerfectScale applies the startup recommendation when the pod is created. After the pod runs steadily, PerfectScale applies the runtime recommendation in place, without a restart. PerfectScale tracks the phase of each pod, and it adds safety checks when a workload cannot move to the runtime phase cleanly.
In-place resize needs Kubernetes 1.33 or later and the container resize policy restartPolicy: NotRequired. It supports Deployments, StatefulSets, DaemonSets, and Argo Rollouts, and it does not support Windows pods. When the cluster does not support in-place resize, PerfectScale falls back to its standard safe approach.
PerfectScale protects the JVM heap. When you set a maximum or minimum heap size, PerfectScale does not apply a recommendation that goes outside it. For in-place resize, the memory limit can only increase. For Java containers, PerfectScale also collects heap, non-heap, and garbage collection data. It shows the GC time, the active processor count, and the GC type. You can enable JVM metrics collection when you install the PerfectScale agent, and it supports Linux nodes only. PerfectScale shows startup and steady-state resources separately, so the cost and waste numbers reflect what the workload needed in each phase.
Join the workshop. Vikram Seshadri from DoiT shows how to size a JVM pod for its startup, and how to resize it to steady state without a restart, in the hands-on workshop “Java on K8s: The Startup vs. Steady-State Sizing Dilemma” on October 28, 2026 at 11 AM ET. Save your seat.
Do you want to see how PerfectScale right-sizes your Java workloads? Start for free or book a demo.