
PerfectScale
Kubernetes CPU Throttling & OOM Kills: Find Startup Spikes
Kubernetes CPU throttling and OOM kills that only hit at pod startup hide behind averages. The metrics, PromQL, and views that expose them.
This page is also available in Deutsch, Español, Français, Italiano, 日本語, and Português.


About Josh Palmer
Head of Content
I'm Josh Palmer, Head of Content at DoiT, where I split my time across multiple business units including DoiT Cloud Intelligence, PerfectScale (Kubernetes cost optimization), and SELECT (Snowflake, Databricks, and BigQuery cost optimization). Before DoiT, I spent four and a half years at OnBoard building content for a board intelligence platform used by 6,000+ organizations, and before that, two years as Content Marketing Manager at Zylo, a SaaS management platform.
My personal pageTL;DR
- A startup spike is the burst of CPU and memory a container needs during initialization (class loading, JIT compilation, dependency loading, cache warming, connection pools) that drops off once the process reaches steady state.
- Averages and even p99 over a week hide it. A 45-second burst inside a 7-day window is less than 0.01% of samples, so any recommendation built on blended usage sizes the pod for the wrong phase.
- The spike shows up as CPU throttling, OOM kills with exit code 137, failed readiness probes, and slow rollouts that all cluster in the first minute of a container's life, then disappear.
- Detect it by plotting usage against container age instead of wall-clock time, and by filtering throttling and OOM metrics to young containers.
- Once you can see the two phases separately, you can size for each one instead of picking which incident you prefer.
Your service runs fine. CPU sits at 15% of its limit, memory at 60%, no alerts. Then a rollout replaces 40 pods, half of them get throttled for 50 seconds, three get OOM killed on first boot, readiness probes fail, and the rollout stalls. Ten minutes later everything looks healthy again and the dashboards show nothing out of the ordinary.
That is a startup spike, and it hides because every metric you use to size workloads averages it away.
What is a Kubernetes startup spike?
A startup spike is the window after a container starts when it uses far more CPU and memory than it will at steady state. The process loads code, compiles or interprets it, builds its dependency graph, opens connection pools, warms caches, and runs migrations. All of that is CPU-bound and often memory-hungry. Once it finishes, usage falls to a fraction of the peak and stays there until the pod dies.
The gap between the two phases varies by runtime. A Spring Boot service can burn three to ten times its steady-state CPU for 10 to 60 seconds while the JIT compiler works. A Node.js service does the same thing on a smaller scale during synchronous require() resolution and V8 warmup. Rails and Django apps spend their startup on eager loading and autoloaders. The shape is the same every time: a short, sharp peak followed by a long, low plateau.
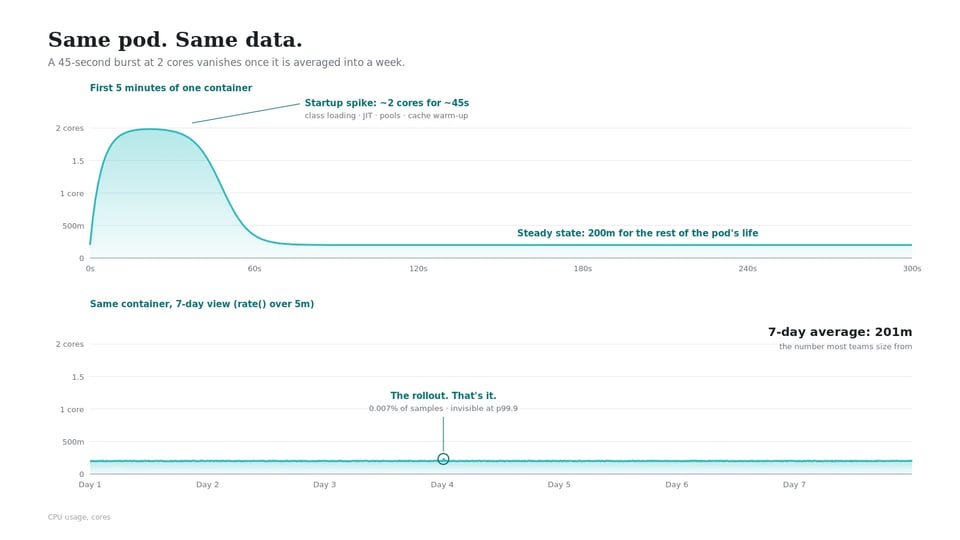
Kubernetes doesn't know the difference. Requests and limits are one number per container, applied from the first millisecond to the last. So you either size for the peak and pay for it on every replica forever, or size for the plateau and let the peak run into the limit.
Why your dashboards don't show it
The math works against you. Take a pod with a 45-second startup burst at 2 cores and a steady state of 200m. Over a 24-hour day its average CPU usage comes to roughly 201m. The spike adds less than one millicore to the number most teams size from.
Percentiles don't rescue you either. A 45-second spike inside a 7-day lookback covers about 0.007% of samples. It doesn't register at p95, p99, or p99.9. A VPA running on its default histogram-based recommender will recommend the plateau, and the next rollout will throttle on the way up.
Scrape interval makes it worse. Prometheus scraping every 30 or 60 seconds can miss a 20-second burst entirely, or catch one sample of it that gets smoothed by rate() over a 5-minute window. Your dashboard shows a gentle bump where the container hit a wall.
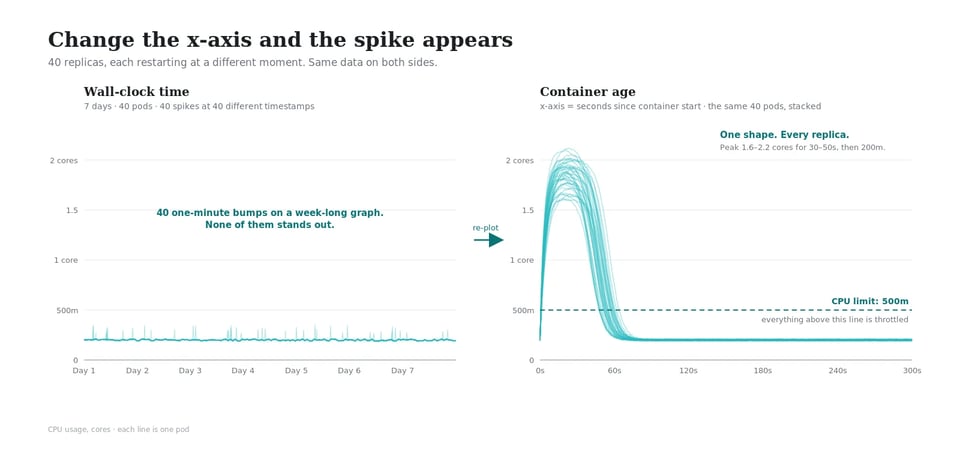
Wall-clock time scatters the evidence too. With 40 replicas that restart at different moments, 40 spikes land at 40 different timestamps, each lasting about a minute on a graph that covers a week. None of them stands out.
Where the spike surfaces: the symptoms people actually search for
Nobody searches for "startup spike." They search for the incident it caused. Each of these has a steady-state explanation and a startup explanation, and the fix differs depending on which one you have.
| Symptom | What you see | Steady-state cause | Startup cause |
|---|---|---|---|
| CPU throttling | Latency, slow boot, nr_throttled climbing in cpu.stat |
Limit set below real sustained load | Limit sized for steady state; JIT or module loading hits the CFS quota in the first minute |
| OOMKilled (exit 137) | Last State: Terminated, Reason: OOMKilled, restarts counter at 1 |
Memory leak or load-driven growth | Initialization allocates more than the plateau; JVM heap sizing, migration, cache preload |
| Readiness probe failures | Unhealthy events, pod stuck 0/1 Ready |
App is actually down or overloaded | Throttled startup pushes boot past initialDelaySeconds and failureThreshold |
| CrashLoopBackOff | Restart counter climbing, backoff growing | Config or dependency failure | Startup OOM or probe failure on every attempt, never reaching steady state |
| Slow or stalled rollouts | kubectl rollout status hangs, maxUnavailable exhausted |
Insufficient cluster capacity | New pods take minutes to pass readiness because startup runs throttled |
| HPA flapping | Replicas scale out, then straight back in | Real traffic bursts | New replicas' startup CPU trips the target utilization, HPA adds more, which also spike |
Timing separates the two columns. If throttling, OOM kills, or probe failures cluster in the first 60 to 120 seconds of container life and never recur, you have a startup problem. If they show up at random points in a pod's lifetime, you have a steady-state sizing problem. CPU throttling and OOMKilled each deserve their own troubleshooting path, but the first question for both is the same: how old was the container when it happened?
The metrics that expose a startup spike
You already collect everything you need. The trick is filtering by container age.
1. CPU throttling in young containers
cAdvisor exposes two counters per container: container_cpu_cfs_periods_total (how many 100ms CFS periods elapsed) and container_cpu_cfs_throttled_periods_total (how many of those periods the container got throttled). The ratio is your throttling percentage.
To isolate startup, join against container_start_time_seconds and keep only containers under two minutes old:
( rate(container_cpu_cfs_throttled_periods_total{container!=""}[1m]) / rate(container_cpu_cfs_periods_total{container!=""}[1m]))and on (pod, container) (time() - container_start_time_seconds{container!=""}) < 120Compare it against the same ratio for containers older than ten minutes. A workload that throttles 60% of periods in its first two minutes and 2% afterward has a startup spike, and raising the request will fix it. A workload that throttles 30% all day has a different problem.
You can also read it straight off the node. Inside a running container, cat /sys/fs/cgroup/cpu.stat prints nr_periods, nr_throttled, and throttled_usec. If nr_throttled jumps in the first minute and then freezes, the spike is confirmed.
2. OOM kills on first boot
kube-state-metrics gives you the termination reason and exit code of the previous container instance:
kube_pod_container_status_last_terminated_reason{reason="OOMKilled"} * on (pod, container) group_leftkube_pod_container_status_restarts_totalA restarts_total of 1 next to an OOMKilled reason, repeated across many pods right after a deploy, points at startup allocation rather than a leak, since a leak takes hours to kill a pod and a startup OOM takes seconds.
Then look at peak working set in the first few minutes versus later:
max_over_time(container_memory_working_set_bytes{container="app"}[5m])Run it over a window that includes a rollout. If the peak in the first five minutes sits well above the peak over the following hour, your memory limit needs to clear the startup number, not the steady-state one. For JVM workloads this often traces back to heap settings. A container with -Xmx set to 75% of the limit can still OOM during startup because metaspace, code cache, and thread stacks sit outside the heap.
3. Time to ready
The simplest signal is how long each pod takes to pass its readiness probe:
kube_pod_status_ready_time - kube_pod_start_timePlot it as a histogram across pods in the same Deployment. A tight cluster around 15 seconds with a tail at 90 seconds means some pods landed on busier nodes or got throttled harder. If the tail grows after you tighten CPU limits, you have measured the spike directly.
On the kubectl side, kubectl get events --field-selector reason=Unhealthy -n <namespace> lists probe failures with timestamps. Cross-reference them against pod start times and the pattern jumps out.
The view that makes it obvious: usage by container age
Wall-clock graphs hide startup spikes because every replica spikes at a different time. Re-plot the same data with container age on the x-axis and they stack on top of each other.
In Grafana, the quickest version is a panel that filters to a single pod and sets the time range to start at that pod's creation. CPU usage versus limit for the first five minutes of one pod's life tells you everything: a peak that touches the limit line and flattens means throttling, and the width of that flat top is how long your users waited.
The better version aligns all replicas on "seconds since start." That requires either a recording rule that tags samples with age buckets, or a workload-level tool that profiles each container's lifecycle separately. Either way, the output you want is two numbers per container: peak usage in the startup window, and typical usage after it. Once you have both, the sizing decision stops being a guess.
A detection checklist you can run this week
- Pick the workloads that restart most. Query
increase(kube_pod_container_status_restarts_total[7d])and sort descending. Startup spikes hurt most where startup happens most. - Check whether throttling is age-dependent. Run the young-container throttling query above against the same workloads older than ten minutes. A large gap confirms the spike.
- Check the OOM pattern. For any workload with
OOMKilledinlast_terminated_reason, look atrestarts_total. Low counts clustered after deploys mean startup OOM. - Measure time to ready across a rollout. Trigger a rollout in staging, record the readiness histogram, then halve the CPU limit and run it again. The delta is your spike's cost in seconds.
- Look at the first 300 seconds of one pod. One Grafana panel, one pod, usage against limit. If the line flattens against the limit, write down how long.
- Separate the two numbers. For each spiky workload, record startup peak and steady-state p95. The ratio between them tells you how much you overpay if you size for the peak, and how much you throttle if you size for the plateau.
The fixes that quietly make it worse
A few common responses hide the symptom instead of resolving it.
Adding a startupProbe with a generous failureThreshold stops the restart loop, which is the right call for reliability, but it also stops the alert. The pod still boots throttled for 90 seconds and users still wait for it; you just stop seeing it.
Raising the CPU request to cover the peak fixes throttling and locks in waste across every replica for the rest of its life. On a 40-replica service with a 2-core spike and a 200m plateau, that decision reserves 72 cores that sit idle for 99.9% of the time. It also hurts bin-packing, since the scheduler places pods by request, and inflated requests mean fewer pods per node and more nodes than you need.
Removing CPU limits entirely, which PerfectScale recommends for most workloads in the CPU limits guide, does let startup burst into idle node capacity. It helps, and it's usually the right default. But it only works when the node has idle CPU at the moment the pod starts. During a rollout, when 20 new pods land on the same fresh node and all start compiling at once, there is no idle CPU to burst into. The spike comes back as contention instead of throttling.
Each of these is a reasonable move on its own. The problem is that all three keep treating the container as one number when its usage has two distinct shapes.
Sizing for two phases instead of one
Kubernetes now has the primitive that makes a two-phase approach possible. In-place pod resize, which lets you change a running container's requests and limits without restarting it, went stable in 1.35 and ships on by default in 1.36 (PerfectScale tested the alpha back in 2024, bugs and all). GKE already uses it for its startup CPU boost feature. The pattern is simple: give the pod what it needs to boot, then take it back once it reaches steady state.
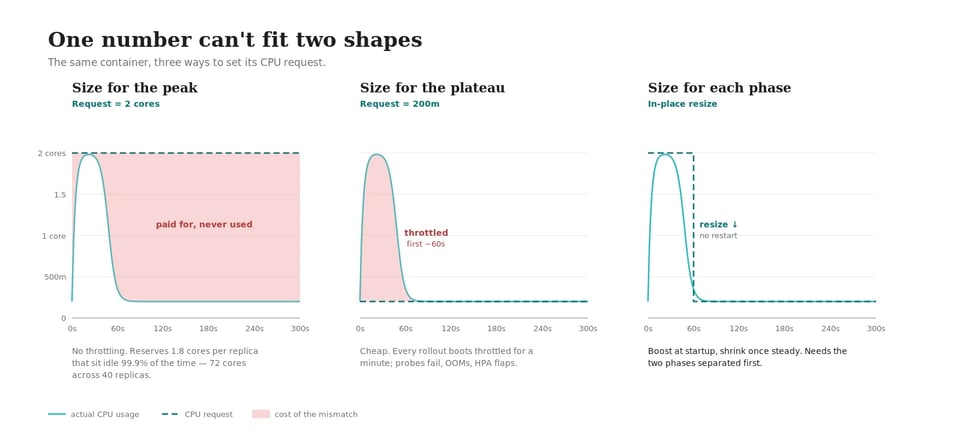
That only works if you can tell the two phases apart in the first place, which is what everything above is for.
FAQ
What is CPU throttling in Kubernetes? CPU throttling happens when a container tries to use more CPU time than its limit allows within a CFS scheduling period (100ms by default). The kernel pauses the container until the next period starts. A limit of 500m lets a container run for 50ms out of every 100ms; use that up early and the container waits. Throttling slows the application without crashing it, and it can occur even when the node has idle CPU.
Why does my pod get OOM killed only on startup? Initialization often allocates more memory than steady-state operation: loading classes, building caches, running migrations, or sizing a JVM heap before the application knows its real working set. If the memory limit clears the steady-state number but not the startup peak, the kernel kills the container during boot with exit code 137. Once it survives startup, usage drops below the limit and the pod runs normally, which is why the restart count usually stops at one or two.
How do I tell a startup spike from a steady-state sizing problem? Filter your throttling and OOM metrics by container age. If the problems concentrate in the first one to two minutes of a container's life and disappear afterward, it's a startup spike. If they occur at random points throughout the pod's lifetime, the steady-state request or limit is wrong.
Does removing CPU limits fix startup throttling? It removes the CFS quota, so the container can burst into whatever idle CPU the node has. That helps when nodes have headroom. It doesn't help during a rollout when many pods start on the same node simultaneously, because there is no idle CPU to burst into. The request still determines scheduling, so an undersized request can still land too many spiky pods on one node.
Seeing both phases of every workload
Everything above you can build by hand with Prometheus, kube-state-metrics, and a few Grafana panels. The hard part is doing it for 400 workloads and keeping it current as code changes shift where the spike lands.
PerfectScale by DoiT profiles every container at the workload level, so startup behavior and steady-state behavior show up as separate patterns rather than one blended average. For Java workloads it goes a layer deeper: once the Coroot agent is enabled, it detects JVM containers automatically and tracks heap, non-heap, and GC time over time, flags containers running without explicit heap settings, and respects -Xms and -Xmx when it makes a recommendation or applies a change. On clusters running Kubernetes 1.33 or later, its automation applies right-sizing in place, without restarting the pod, and falls back to a rolling restart only when a resize isn't feasible on the current node.

Want to see the startup spike flattened live? Join the JVM startup spike workshop, where we walk through what happens inside the JVM at boot and resize a running pod down to steady state with no restart. Or book a technical session and we'll look at your clusters.