Subscribe to our newsletter
Thank you! Your submission has been received!
Oops! Something went wrong while submitting the form.


A decade ago, Java tuning meant adjusting heap sizes and garbage collectors on virtual machines or bare metal. Today, Java runs inside containers, orchestrated by Kubernetes, and that completely changes how the JVM behaves.
In such an environment, CPU and memory limits are not just values - they directly influence heap sizing, garbage collection mode, startup performance, and application stability.
The challenge is that most Java workloads weren’t designed with containers in mind. An application may experience a CPU spike during startup, unexpected OOMKill even when the heap looks “normal,” and silent GC mode switches when CPU or memory limits change. These issues aren’t caused by bad code - they happen because the JVM and Kubernetes make decisions independently unless tuned to work together.
In 2026, Java optimization is not just about tweaking -Xmx or enabling a new GC, but rather about making the JVM container-aware, ensuring memory, CPU, GC behavior, and Kubernetes resource limits stay in sync.
The goal is simple: maximum performance without wasted resources or instability.
The next five go-to strategies outline how to achieve that balance, from smarter heap allocation and CPU right-sizing to automated JVM optimization.
Let's dig in!
Memory management is the foundation of Java performance, particularly in Kubernetes, where it’s often the main driver of instability. The JVM divides memory into two main areas: heap (application data) and non-heap (Metaspace, code cache, thread stacks, etc.). Additionally, some memory is always reserved for the OS itself.
Modern Java versions are smart enough to detect container memory limits and automatically assign heap size using internal “ergonomics”, but the defaults aren’t always optimal. A 2 GB container may end up with only ~512 MB of heap because the JVM caps it at ~25% leaving most of the available space unused.
Also, if you manually set -Xmx (maximum heap size) too close to the container’s memory limit, you run the risk of starving non-heap memory or native threads, resulting in out-of-memory (OOM) errors even when heap usage looks normal.
The solution lies in achieving balance: allocate approximately 50–70% of container memory to the heap and reserve the rest of the memory for non-heap + native overhead. This allows the JVM to remain stable, reduces OOM risks, and ensures autoscaling metrics reflect real application behavior.
apiVersion: apps/v1
kind: Deployment
metadata:
  name: java-app
spec:
  template:
    spec:
      containers:
        - name: app
          image: your-java-app
          resources:
            requests:
              memory: "1Gi"
            limits:
              memory: "2Gi"
          env:
            - name: JAVA_TOOL_OPTIONS
              value: "-Xmx1400m -Xms1400m"   # ~70% of container
limit
The Java Virtual Machine selects the Garbage Collection (GC) mode based on the number of CPU cores available, along with the amount of memory assigned to the container. On modern JDK versions (11.0.17+, 17.0.5+, 18.0.2+), the JVM no longer uses CPU requests to calculate processors. It derives core count from CPU limits (quota) or cpuset settings. If no CPU limit is set, the JVM may assume it can use all CPUs on the host node.
When the JVM detects fewer than 2 CPUs, it selects SerialGC (single-threaded). When it sees 2+ CPUs and ~2 GB of memory, it upgrades to ParallelGC (multi-threaded), which improves throughput by running multiple GC threads. Because this selection is automatic, a small change in container CPU limits can switch garbage collectors resulting in higher pause times and degraded latency.
If you lower or remove CPU limits to save cost or pack more pods per node, the JVM may either downgrade to SerialGC or think it has far more cores than intended, both leading to unstable GC behavior.
To prevent this:
-XX:ActiveProcessorCount=<n>;
resources:
  limits:
    cpu: "1200m"   # JVM sees ≈2 cores → stays on ParallelGC
env:
  - name: JAVA_TOOL_OPTIONS
    value: "-XX:+UseParallelGC"
Heap sizing is one of the most misunderstood aspects of running Java in containers. By default, the JVM dynamically grows the heap size from the initial size (-Xms) to the maximum size (-Xmx) as the application needs more memory. While this behavior made sense on a traditional server, it does not work well in containers where memory limits are fixed and strict.
When the heap expands dynamically, the JVM triggers additional garbage collection cycles and memory reallocation, which can lead to sudden CPU spikes or even OOM kills if the container runs out of memory before the JVM stabilizes. In a Kubernetes environment, these fluctuations can also interfere with autoscaling decisions.
The better approach in K8s is fixed heap sizing: by setting -Xms equal to -Xmx, you give the JVM a fixed, pre-allocated heap size that never grows or shrinks. This approach ensures a steady memory footprint, reduces GC overhead, and eliminates runtime surprises when the JVM tries to expand beyond what the container can actually provide.
It’s also wise to keep a safety buffer! Do not allocate the entire container memory to the heap. Reserve about 20–30% for non-heap memory + OS.
This gives you a good safety margin, so your pod doesn’t wig out under high load, or when loading new threads and libraries on the fly.
env:
  - name: JAVA_TOOL_OPTIONS
    value: "-Xms1024m -Xmx1024m"    # fixed heap, no dynamic growth
resources:
  limits:
    memory: "1536Mi"                # ~1.5Gi container
In 2026, visibility is not optional! It’s how teams prevent silent performance regressions before they escalate.
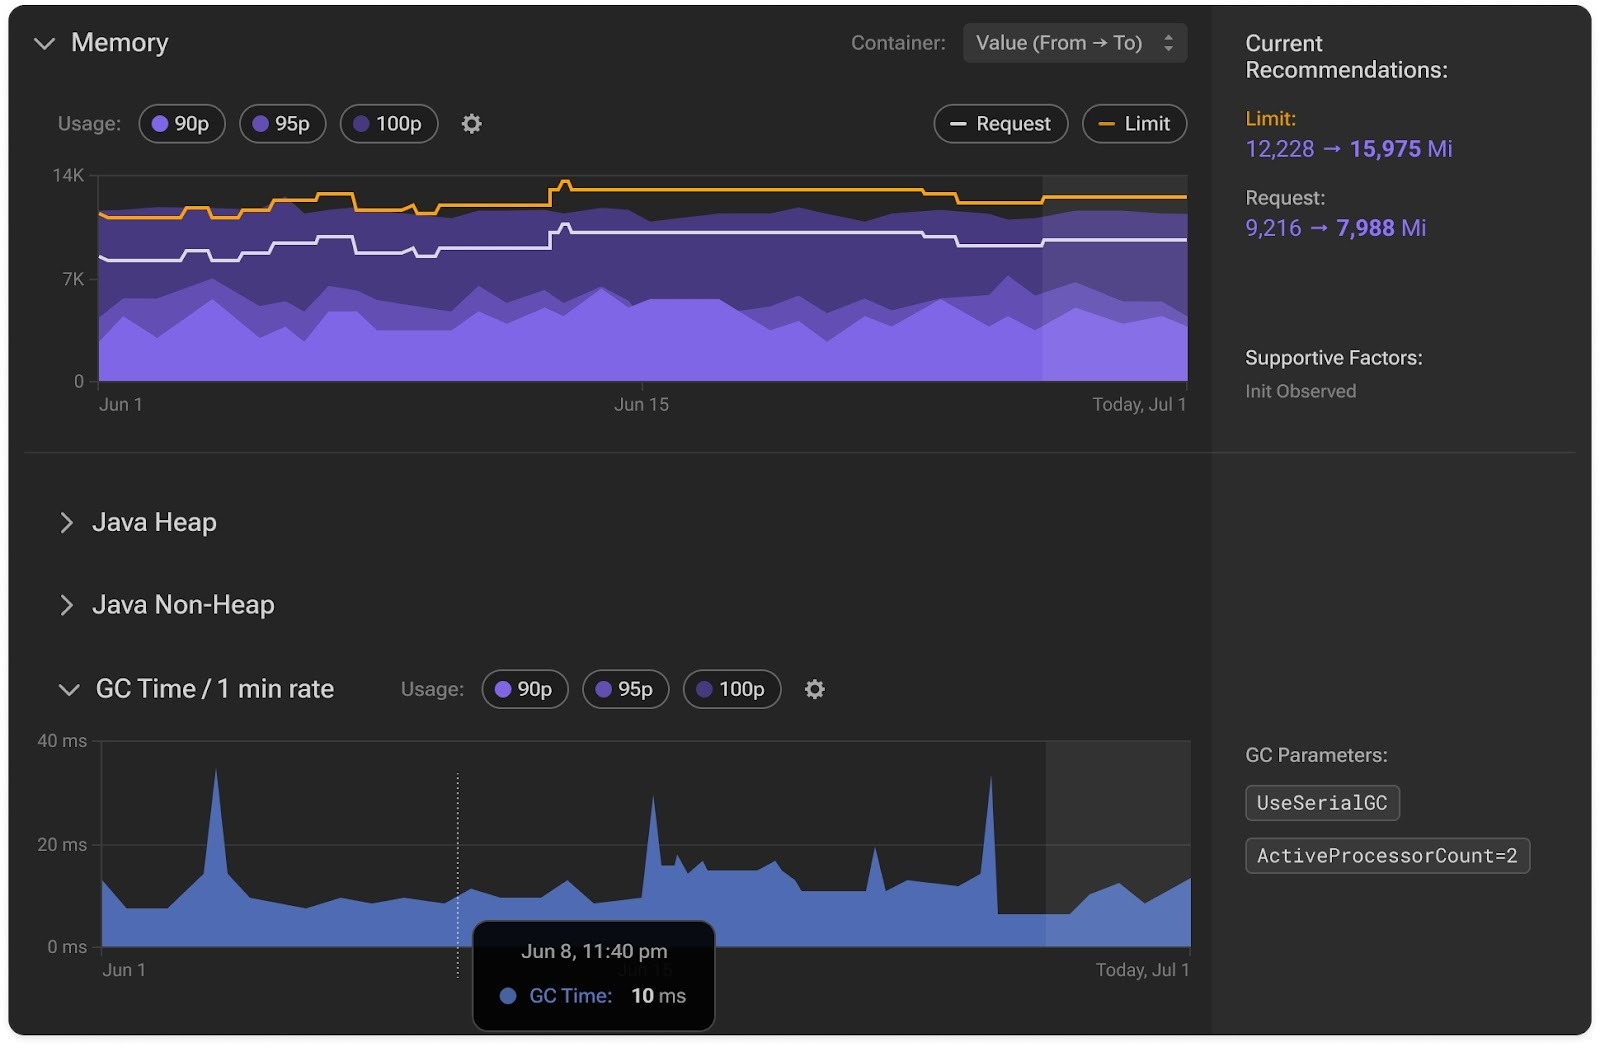
To truly understand Java performance, you need to monitor heap, non-heap, and GC time together. Watching just container memory or CPU metrics doesn’t tell the whole story.
The most effective approach combines JVM-level metrics with container insights. That means tracking not only how much memory the JVM is using, but how close that usage is to the pod’s actual Kubernetes limits. This alignment lets you catch problems early, like a heap slowly approaching container capacity, or GC pauses creeping up as CPU throttling kicks in.
When you understand how JVM behavior correlates with workload patterns, you can right-size resources confidently instead of guessing.
env:
  - name: JAVA_TOOL_OPTIONS
    value: >
      -XX:+UseG1GC
      -Xlog:gc*:stdout:time,level,tags
      -XX:+PrintHeapAtGC
      -XX:+UnlockExperimentalVMOptions
      -XX:+UseContainerSupport
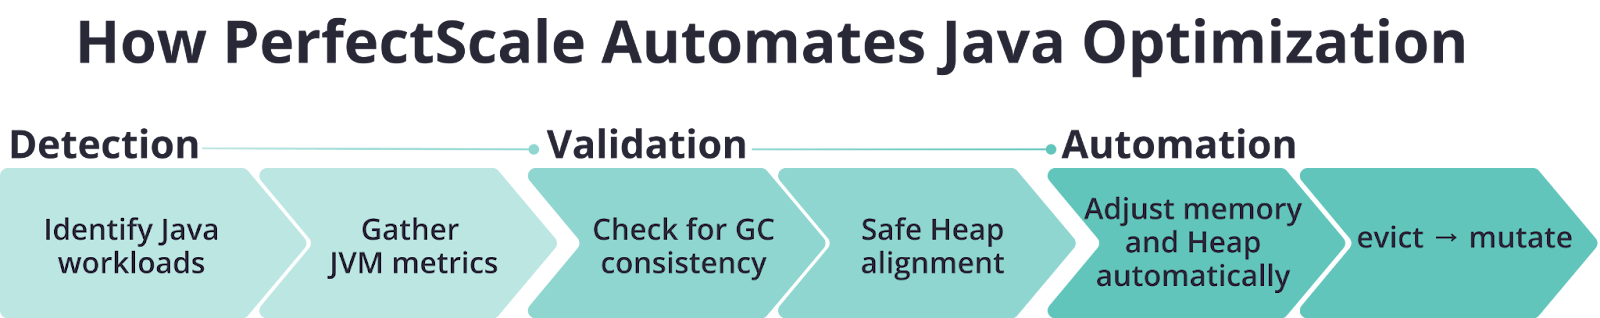
Kubernetes continuously adjusts pods and resources based on real-time demand. Manual JVM optimization can’t keep up with this pace: it’s too reactive, too human-dependent, and too slow for today’s dynamic environments. That’s exactly the problem PerfectScale’s new Java Optimization feature was built to solve.
This feature introduces a self-tuning, automated approach to managing Java workloads in Kubernetes. Instead of relying on manually guestimated Xmx, CPU limits, or GC flags, PerfectScale continuously analyzes the behavior and JVM patterns of your applications and autonomously optimizes resources.
PerfectScale automatically identifies Java containers across your clusters using an intelligent eBPF-based layer. Once detected, it starts collecting JVM-specific metrics such as heap and non-heap memory usage, GC time per minute, and even JVM parameters like -Xmx, -Xms, and ActiveProcessorCount. This gives you full visibility into how Java actually uses the container’s resources.
Before applying any new resource recommendations, PerfectScale validates them against JVM behavior. It checks if a change could unintentionally switch the garbage collector (for example, from ParallelGC to SerialGC) or create unsafe heap-to-memory ratios. If a proposed memory or CPU adjustment would break JVM behavior, the recommendation is automatically rejected or corrected, ensuring Java workloads stay optimized and predictable.
PerfectScale can now automatically adjust memory requests, limits, and heap configurations together through a controlled “evict → mutate” rollout or in-place right-sizing when supported. This ensures that every Java container stays in perfect sync with its JVM’s needs while maintaining the correct GC mode and preventing OOM issues.
PerfectScale’s intelligent optimization continuously monitors JVM metrics, adapts configurations, and maintains efficiency without the need for manual intervention. This approach enables teams to seamlessly optimize resource utilization and cut cloud costs safely, ensuring their services remain efficient and maintain consistent performance.
Ready to see it in action? Learn more in our documentation or book a technical session with our experts.
New to PerfectScale by DoiT? Get started today for free!


Install in minutes and instantly receive actionable intelligence.
.png)


.png)