


What Is Kubernetes Observability?
Kubernetes observability is the process of collecting, aggregating, and analyzing telemetry data to understand the internal state, performance, and health of a Kubernetes cluster and its workloads. Unlike traditional infrastructure monitoring, which merely alerts you when a static metric baseline is breached, observability allows you to infer why a system is misbehaving by providing end-to-end visibility into highly dynamic, ephemeral microservices.
Observability helps teams investigate failures, performance problems, and unexpected behavior across a distributed environment. For example, metrics can reveal resource saturation, logs can explain why a container failed, and traces can show where latency occurs across services. Combining these signals makes it easier to identify the root cause instead of examining each component separately.
The 4 pillars of Kubernetes observability:
- Metrics: Quantitative, time-series data measuring system characteristics (e.g., CPU utilization, memory footprints, and network I/O). In Kubernetes, components emit these via
/metricsendpoints, usually formatted for Prometheus. - Logs: Chronological text records of events generated by applications, the control plane (API server, scheduler), or nodes. Essential for diagnosing specific error traces and sequence failures.
- Traces: End-to-end maps tracking how a single request travels across various microservices and infrastructure barriers. They are vital for identifying network bottlenecks and latency issues.
- Profiles: Continuous application performance profiling (often powered by eBPF technology) that measures CPU/memory down to the exact line of code without introducing agent overhead.
This is part of a series of articles about Kubernetes monitoring
In this article:
- Why Is Kubernetes Observability Important?
- Kubernetes Observability vs. Monitoring
- 4 Pillars of Kubernetes Observability
- Key Kubernetes Observability Metrics to Monitor
- Kubernetes Observability Challenges and How to Overcome Them
- Kubernetes Observability Best Practices
Why Is Kubernetes Observability Important?
Kubernetes environments are dynamic. Pods restart, workloads move between nodes, and resources scale automatically. Observability gives teams the data needed to understand these changes and detect problems before they affect users.
- Faster troubleshooting: Metrics, logs, and traces help teams identify where failures occur and determine their root cause.
- Performance monitoring: Observability shows resource usage, application latency, error rates, and other signals that can reveal performance bottlenecks.
- Resource optimization: CPU, memory, and storage data helps teams find overprovisioned or constrained workloads and adjust resource requests and limits.
- Improved reliability: Monitoring cluster and application health helps teams detect failing pods, unavailable services, node problems, and other conditions that can reduce availability.
- Better visibility into distributed systems: Kubernetes applications often span many pods and services. Observability connects signals across these components, making dependencies and request flows easier to understand.
- Capacity planning: Historical usage and performance data helps teams estimate future infrastructure requirements and make informed scaling decisions.
Kubernetes Observability vs. Monitoring
Monitoring tracks predefined metrics and conditions to determine whether Kubernetes components are operating as expected. Teams typically use dashboards and alerts to watch signals such as CPU usage, pod availability, restart counts, and request latency. It works well for detecting known failure conditions and answering questions that teams anticipated when configuring the monitoring system.
Observability provides broader context for investigating problems that were not predicted in advance. It combines metrics, logs, traces, events, and Kubernetes metadata to help teams explore relationships between workloads and infrastructure. For example, monitoring might alert that request latency has increased, while observability can help determine whether the cause is a slow downstream service, resource throttling, or a failing node.
Monitoring is therefore a part of Kubernetes observability rather than a separate alternative. Monitoring identifies symptoms based on known signals, while observability provides the data and context needed to investigate both known and unexpected behavior.
Related content: Read our article about Kubernetes monitoring tools
4 Pillars of Kubernetes Observability
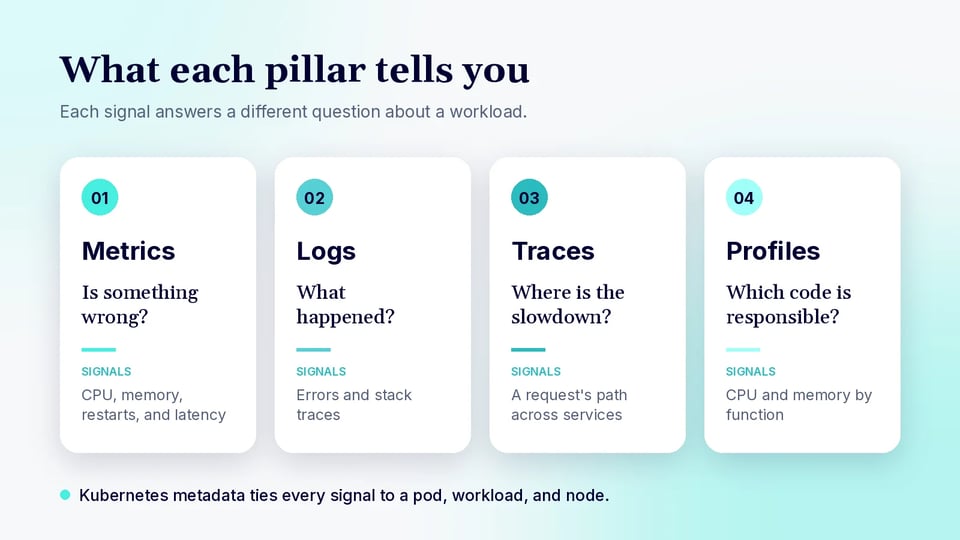
Traditionally, observability was based on three pillars: metrics, logs, and traces. However, in cloud native environments there is increasing use of a fourth element: profiles.
1. Metrics
Metrics are numerical measurements collected over time from Kubernetes infrastructure and applications. Common examples include CPU and memory usage, pod restart counts, request rates, error rates, and response latency. Metrics are efficient to aggregate and query, making them useful for dashboards, alerts, capacity planning, and detecting changes in system behavior.
Kubernetes metrics can come from nodes, containers, control plane components, and applications. Labels and other Kubernetes metadata provide context such as namespace, workload, pod, and node, helping teams determine which resources are associated with a performance or reliability problem.
2. Logs
Logs are timestamped records of events generated by applications, containers, Kubernetes components, and the underlying infrastructure. They can contain error messages, stack traces, request details, state changes, and other information that explains what happened at a specific point in time.
Because pods can be short-lived, relying on logs stored inside containers can make historical investigation difficult. Centralized log collection preserves logs outside the pod lifecycle and makes them searchable across workloads. Adding Kubernetes metadata such as pod, namespace, container, and node also helps teams correlate log entries with the resources that produced them.
3. Traces
Traces record how individual requests move through distributed applications. A trace consists of spans representing operations performed by services, databases, queues, and other components. Each span can include timing information, status, attributes, and relationships with other spans.
Tracing is particularly useful in Kubernetes environments built from microservices. When a request is slow or fails, teams can follow its path across services to identify the operation responsible. Trace data can also be correlated with metrics and logs to connect application-level symptoms with detailed diagnostic information.
4. Profiles
Profiles measure how an application consumes resources while its code executes. Profilers can sample CPU usage, memory allocations, lock contention, and other runtime behavior, then associate resource consumption with specific functions or code paths.
Continuous profiling extends this analysis across production workloads over time. It can reveal code that consumes excessive CPU or memory even when infrastructure metrics only show that a pod is resource constrained. Combined with metrics, logs, and traces, profiles help teams move from identifying an affected workload to locating inefficient application code.
Key Kubernetes Observability Metrics to Monitor
Kubernetes produces metrics at several layers, from cluster infrastructure to individual applications. Monitoring a focused set of metrics helps teams detect resource constraints, workload failures, scaling problems, and application performance issues.
| Metric | What it Measures | Why it Matters |
|---|---|---|
| CPU usage and throttling | CPU consumed by nodes, pods, and containers, plus whether CPU limits are throttling workloads | Identifies resource constraints and workloads being restricted by CPU limits |
| Memory usage | Memory consumed by workloads and nodes | Helps detect workloads nearing limits or nodes experiencing memory pressure |
| Pod status and availability | Running, pending, failed, and unavailable pods | Reveals deployment, scheduling, or availability issues |
| Container restart count | Number of times containers restart | Indicates crashes, failed health checks, or resource-limit problems |
| Node health and resource utilization | Node readiness, CPU, memory, disk usage, and resource pressure | Detects infrastructure issues affecting cluster stability |
| Resource requests and limits | Requested and limited resources compared with actual usage | Identifies overprovisioned or constrained workloads |
| Network traffic and errors | Traffic volume, packet errors, and dropped packets | Helps diagnose connectivity and network performance problems |
| Request rate, errors, and latency | Application traffic, failed requests, and response times | Measures service health and user-facing performance |
| Persistent volume usage | Storage capacity and utilization | Identifies volumes at risk of running out of space |
| Kubernetes control plane metrics | API server, scheduler, and etcd latency, errors, and health signals | Detects control plane issues that can affect cluster operations |
Related content: Read our article about Kubernetes alerting
Kubernetes Observability Challenges and How to Overcome Them
Short-Lived and Ephemeral Workloads
Kubernetes frequently creates, replaces, and removes pods as applications scale, deployments change, or failures occur. When a pod disappears, locally stored logs and runtime information may disappear with it. This can make failures difficult to investigate after the affected workload no longer exists.
Observability systems need to collect telemetry continuously and store it outside individual workloads. Kubernetes metadata such as pod name, namespace, deployment, node, and labels can preserve the context needed to analyze events even after resources have been replaced.
How to overcome:
- Collect logs, metrics, traces, and events continuously instead of relying on telemetry stored inside pods.
- Send telemetry to centralized storage that persists independently of pod and node lifecycles.
- Enrich telemetry with Kubernetes metadata such as namespace, workload, pod, container, node, and labels.
- Monitor pod lifecycle events, container restarts, evictions, and termination reasons to preserve failure context.
- Use stable workload identifiers such as deployment or statefulset names when querying historical telemetry.
Large Volumes of Logs and Telemetry Data
Large Kubernetes environments can generate substantial volumes of metrics, logs, traces, and profiles. Autoscaling and microservice architectures increase the number of telemetry sources, while high-cardinality labels such as pod IDs can significantly increase storage and query costs.
Teams need to control telemetry volume without removing data required for troubleshooting. Common approaches include log filtering, trace sampling, metric aggregation, retention policies, and limiting unnecessary high-cardinality attributes. Collection policies should prioritize signals that provide useful operational information.
How to overcome:
- Filter repetitive, low-value logs at the collection layer before sending them to centralized storage.
- Use trace sampling to retain representative requests while capturing errors and high-latency traces at higher rates.
- Aggregate metrics where detailed per-pod or per-container data is not required.
- Limit high-cardinality labels and attributes, especially identifiers that create a unique time series for each request or resource.
- Define retention policies by telemetry type and operational value, keeping high-resolution data only as long as needed for troubleshooting.
Multi-Cluster Visibility
Organizations often operate multiple Kubernetes clusters across regions, cloud providers, environments, or business units. Observing each cluster independently creates fragmented dashboards and makes it harder to compare performance, investigate shared dependencies, or understand system-wide incidents.
Centralizing or federating telemetry can provide a consistent view across clusters. Cluster identifiers and standardized labels help distinguish resources while supporting cross-cluster queries. Teams also need to account for network connectivity, data residency, access controls, and the cost of transferring telemetry between environments.
How to overcome:
- Centralize or federate telemetry from multiple clusters so teams can query and compare environments from a common interface.
- Apply consistent labels for cluster, region, environment, namespace, and workload across telemetry sources.
- Standardize dashboards, alerts, and telemetry collection policies across clusters where operational requirements are similar.
- Apply access controls so users can view only the clusters and telemetry relevant to their responsibilities.
- Account for data residency, network bandwidth, availability, and telemetry transfer costs when choosing where data is stored and processed.
Correlating Data Across Microservices
A single user request can pass through many services, pods, databases, and queues. Metrics may show that a service is slow, while the relevant error appears in another service's logs. Without shared context, teams must manually connect signals from different systems.
Consistent service metadata and identifiers such as trace and request IDs make correlation easier. Distributed tracing can connect operations across service boundaries, while Kubernetes metadata links application telemetry to pods and nodes. This allows teams to move from a high-level symptom to the specific service, workload, or infrastructure component involved.
How to overcome:
- Propagate trace IDs and request IDs across service boundaries so telemetry generated by the same request can be connected.
- Use distributed tracing to follow requests across services, databases, queues, and other dependencies.
- Apply consistent service names and Kubernetes metadata to metrics, logs, and traces.
- Include trace and span identifiers in application logs so engineers can move directly between traces and related log entries.
- Preserve workload, pod, container, and node context so application-level failures can be correlated with Kubernetes infrastructure conditions.
Kubernetes Observability Best Practices
Monitor Both Infrastructure and Application Performance
Monitor Kubernetes infrastructure together with the applications running on it. Node CPU, memory pressure, disk usage, pod status, network conditions, and control plane metrics can reveal infrastructure problems. Request latency, error rates, throughput, application logs, and traces show how those conditions affect services and users.
Correlating both layers helps distinguish application failures from underlying cluster issues. For example, increased latency may result from inefficient application code, CPU throttling, insufficient memory, network problems, or an unhealthy node. Looking at infrastructure and application telemetry together reduces the time needed to isolate the affected layer.
Dependencies should also be included where possible. A Kubernetes workload may appear healthy while requests are delayed by a database, queue, cache, or external API. Distributed traces and service-level metrics help expose these dependencies and show where failures or latency originate.
Compare Resource Requests With Actual Usage
Compare container CPU and memory requests with observed resource consumption. Kubernetes uses requests when scheduling pods, so inaccurate values directly affect how efficiently workloads are placed on nodes. Requests that consistently exceed actual usage can leave capacity unused, while requests that are too low can contribute to contention and unstable performance.
Evaluate usage over representative periods rather than relying on short snapshots. Consider normal traffic, peak demand, deployments, batch jobs, and scheduled workloads so resource settings reflect realistic operating conditions. Percentile-based usage data can be more useful than averages because averages may hide short periods of high demand.
Limits should be evaluated separately from requests. CPU limits can cause throttling when workloads need additional processing capacity, while exceeding a memory limit can terminate a container with an out-of-memory error. Comparing limits, requests, and actual usage provides a more complete view of resource configuration.
Continuously Right-Size Kubernetes Workloads
Resource requirements change as application code, traffic patterns, and dependencies evolve. Review CPU and memory requests and limits regularly instead of treating their initial values as permanent configuration. A workload that was correctly sized when deployed can become overprovisioned or constrained as its behavior changes.
Use historical utilization, CPU throttling, out-of-memory events, latency, and performance data when adjusting resources. Right-sizing should balance efficient cluster utilization with enough capacity for workload variability and expected demand spikes. Changes should also be validated against application performance rather than resource utilization alone.
Automated recommendations can help identify workloads with persistent differences between requested and consumed resources. However, teams should account for startup requirements, bursty workloads, failover capacity, and service-level objectives before applying recommendations.
Monitor Kubernetes at the Workload Level
Pod-level metrics are useful for troubleshooting, but pods are temporary implementation details. Aggregate telemetry by stable workload objects such as deployments, statefulsets, and daemonsets to understand application behavior across pod replacements, rolling updates, and scaling events.
Workload-level monitoring also reduces noise when replicas frequently change. Teams can identify whether an entire workload is degraded and then inspect individual pods, containers, or nodes to isolate the cause. This approach is especially useful when autoscaling creates and removes replicas frequently.
Preserve relationships between workloads and their underlying resources. For example, dashboards should make it possible to move from a deployment with high latency to its pods, containers, nodes, logs, and traces. Kubernetes labels and ownership metadata provide the context needed to maintain these relationships.
Use Historical Data to Identify Resource Trends
Retain enough historical telemetry to distinguish temporary spikes from sustained changes in resource demand. Trends in CPU, memory, storage, request volume, network traffic, and replica counts can reveal gradual capacity constraints that may not trigger immediate alerts.
Historical data also supports capacity planning and configuration changes. Comparing current behavior with previous deployments, traffic periods, or seasonal peaks helps teams determine whether resource growth is expected or indicates a problem. It can also show how changes to resource settings affect performance over time.
Choose retention periods based on operational requirements and expected workload cycles. Short-term high-resolution data is useful for incident investigation, while aggregated long-term data can support monthly or seasonal trend analysis without retaining every raw telemetry point.
Track Autoscaling Behavior
Monitor horizontal and vertical autoscaling decisions alongside the metrics that trigger them. Useful signals include desired and current replica counts, scaling frequency, resource utilization, pending pods, recommendation changes, and whether configured minimum or maximum replica counts are being reached.
Frequent scaling can indicate unstable thresholds, while workloads stuck at maximum capacity may require additional resources or revised scaling policies. Slow scale-out can also cause latency or errors if new pods take too long to become ready. Correlating scaling events with application performance helps determine whether autoscaling is responding effectively to demand.
Also monitor whether the cluster has enough capacity to satisfy scaling decisions. Increasing the desired replica count does not help if pods remain pending because nodes lack CPU or memory. Tracking pod scheduling and cluster autoscaler activity alongside workload autoscaling provides a clearer view of the complete scaling process.
FAQ
What is Kubernetes observability? Kubernetes observability is the practice of collecting, aggregating, and analyzing telemetry data to understand the internal state, performance, and health of a cluster and its workloads. It lets teams infer why a system is misbehaving, not just see that it is.
What is the difference between Kubernetes observability and monitoring? Monitoring tracks predefined metrics and conditions, such as CPU usage or restart counts, and alerts when they are breached. Observability adds metrics, logs, traces, events, and Kubernetes metadata so teams can investigate problems nobody predicted. Monitoring is one part of observability.
What are the four pillars of Kubernetes observability? The four pillars are metrics, logs, traces, and profiles. Metrics are numerical measurements over time, logs are timestamped event records, traces follow a request across services, and profiles show how application code uses CPU and memory.
Why is observability harder in Kubernetes? Pods are short-lived, so logs and runtime data can disappear when a pod is replaced. Large environments also produce huge volumes of telemetry, span multiple clusters, and send a single request through many services, which makes signals hard to connect.
Which Kubernetes metrics should I monitor first? Start with CPU usage and throttling, memory usage, pod status and availability, container restart counts, and node health. Also compare resource requests and limits with actual usage, since that comparison shows overprovisioned and constrained workloads.
Achieving Full Kubernetes Observability with PerfectScale
Collecting metrics, logs, traces, and profiles is only useful if teams can turn those signals into decisions about cost, performance, and stability. PerfectScale delivers full Kubernetes visibility with zero blind spots, using AI-guided insights that surface risk, waste, and optimization opportunities across every cluster. It combines observability, monitoring, and continuous analysis of cost, waste, performance, and other real-time and historical metrics across clusters, namespaces, workloads, and node groups, so teams can keep costs and performance under control while maintaining operational efficiency and environment health.
Key capabilities of PerfectScale:
- Holistic cost view: Provides a complete K8s cost breakdown by cluster, namespace, workload, and label, uncovering optimization opportunities with granular visibility into spending across the entire environment.
- Accurate analysis and insights: Uses default pricing or an integrated custom report, such as AWS CUR, Azure Cost Management, or GCP Cloud Billing, to combine billing data with real-time and historical usage metrics and identify cost trends, waste, idle capacity, and precise cost allocation.
- Policy-driven optimization: Applies customizable optimization policies so resource management aligns with SLA/SLO targets alongside cost-efficiency goals.
- AI-guided automation: Enables flexible, controlled, hands-free automation so teams can tailor every aspect of their optimization strategy.
- Impact-aware alerting: Prioritizes issues automatically and applies budget guardrails, along with cost and resiliency anomaly detection that keeps teams informed before disruptions or unexpected bills occur.
- Performance and resiliency insights: Continuously analyzes performance, workload behavior, and resource usage patterns to proactively detect risks such as CPU throttling, OOM, misconfigured requests and limits, or inefficient scaling, helping prevent pod restarts, performance degradation, latency, and downtime.
- Autonomous workload right-sizing: Eliminates waste without compromising performance through safe, hands-free optimization, with proactive issue remediation driven by predictive intelligence.
- Smart scaling and budgeting: Improves scaling strategy and budget forecasting to support day-2 operations at scale.
- Workflow and observability integrations: Connects developers, DevOps, platform engineers, and FinOps through existing collaboration, ticketing, and observability tools in a unified optimization ecosystem.
Learn more about AI-guided Kubernetes visibility and governance with PerfectScale