Subscribe to our newsletter
Thank you! Your submission has been received!
Oops! Something went wrong while submitting the form.

Hello Everyone! In this blog, you will learn about Kubernetes reliability and a checklist for building resilient applications in Kubernetes.
Let’s start!
Kubernetes reliability is all about making sure your applications and services run consistently and predictably, even when things go wrong. Your cluster should handle various situations without your services going down or performing poorly. This includes everything from ensuring your servers are stable to making sure your Kubernetes setup is configured correctly.
Ultimately, the goal is to keep your applications up and running smoothly, preventing any disruptions that could impact users or business operations. Reliability isn’t a single feature; it’s the harmony of well-provisioned infrastructure, resilient cluster configuration, and operational rigor.
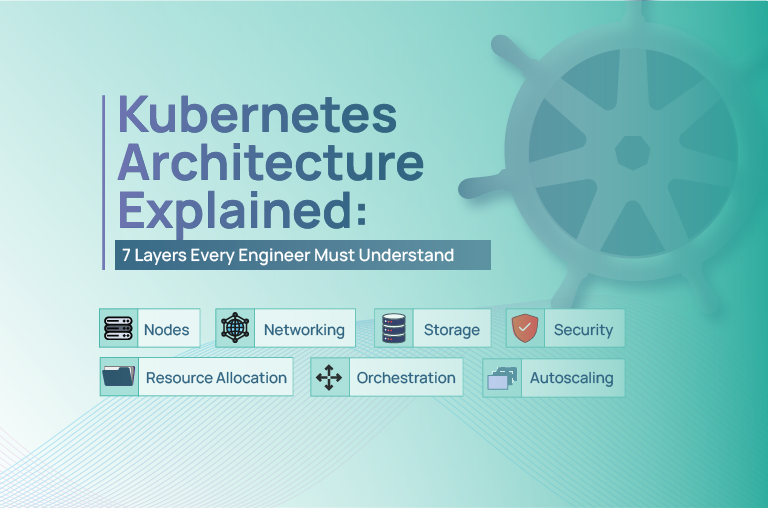
Let’s learn the essential pillars that help your Kubernetes apps stay robust, reliable, and ready for production:
a. Deploy Multiple Control Plane Nodes
To eliminate single points of failure, deploy at least three control plane (master) nodes across different availability zones or data centers. This setup ensures that if one node fails, the others can maintain cluster operations without interruption, improving overall Kubernetes reliability.
b. Implement Load Balancing
Place a load balancer in front of your control plane nodes to distribute API server traffic evenly. This not only balances the load but also provides a single endpoint for clients, enhancing accessibility and Kubernetes reliability.
c. Enable Automated Failover
Configure your infrastructure to automatically detect and replace failed control plane nodes. This proactive approach minimizes downtime and maintains cluster stability, ensuring long-term Kubernetes reliability.
d. Use Managed Kubernetes Services
Consider utilizing managed Kubernetes services like Google Kubernetes Engine (GKE), Amazon Elastic Kubernetes Service (EKS), or Azure Kubernetes Service (AKS), which offer built-in HA configurations and manage control plane availability on your behalf to strengthen Kubernetes reliability.
a. Right-Size Your Nodes
Assess your workloads to determine appropriate CPU, memory, and storage requirements. Avoid under-provisioning, which can lead to resource contention, and over-provisioning, which can be cost-inefficient.
PerfectScale InfraFit feature helps you to view resource alloaction across nodes. It provides actionable data-driven insights, allows you to identify areas with idle space and gain insights into adjusting node sizes based on actual resource utilization to further support Kubernetes reliability.
b. Implement Node Autoscaling
Enable Cluster Autoscaler to automatically adjust the number of nodes in your cluster based on workload demands. This ensures optimal resource utilization and cost-effectiveness.
c. Separate System and Application Workloads
Use node taints and tolerations to segregate system components (like kube-dns, ingress controllers) from application workloads. This separation enhances performance and simplifies troubleshooting.
d. Regularly Update and Patch Nodes
Keep your node operating systems and Kubernetes components up to date with the latest security patches and updates to protect against vulnerabilities.
a. Establish Private Networking
Configure your cluster to use private IP addresses for internal communication between nodes and pods. This setup enhances security by restricting exposure to the public internet.
b. Define Network Policies
Implement Kubernetes Network Policies to control traffic flow between pods. By default, all pods can communicate with each other; network policies allow you to restrict this communication based on namespaces, labels, or ports, adhering to the principle of least privilege.
c. Use Ingress Controllers for External Access
Deploy ingress controllers (like NGINX, Traefik) to manage external access to your services. They provide routing, SSL termination, and load balancing, centralizing and securing entry points.
d. Monitor Network Performance
Utilize tools like Prometheus and Grafana to monitor network metrics, ensuring that latency, throughput, and error rates remain within acceptable thresholds.
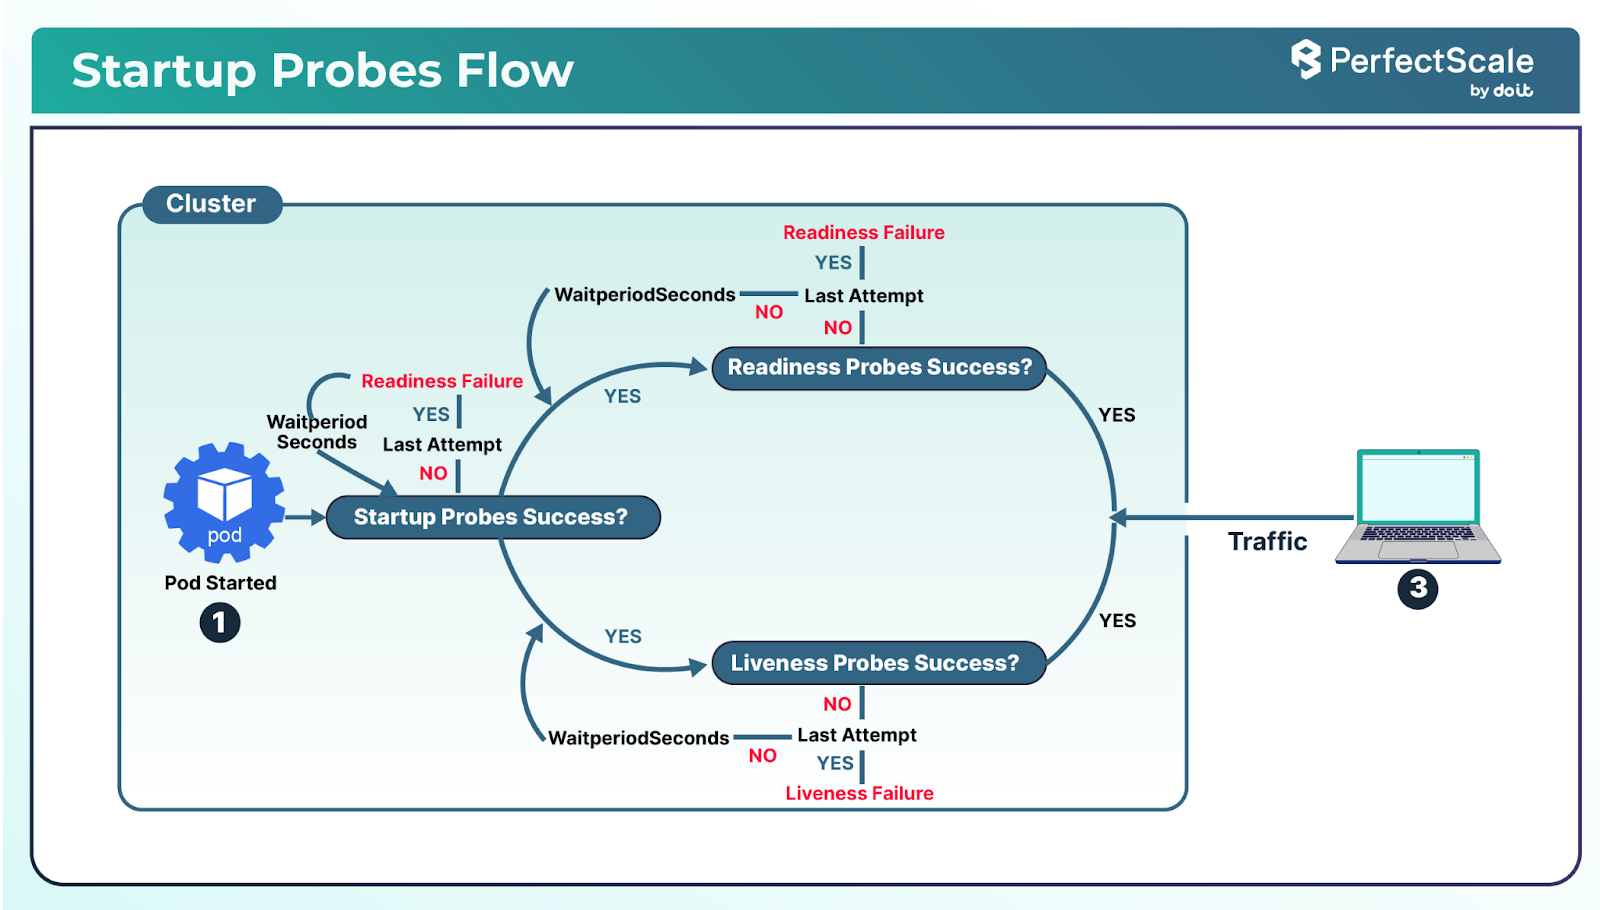
Kubernetes provides mechanisms to monitor the health of applications through probes. Proper configuration of these probes ensures that applications are running correctly and are ready to serve traffic, which directly strengthens Kubernetes reliability.
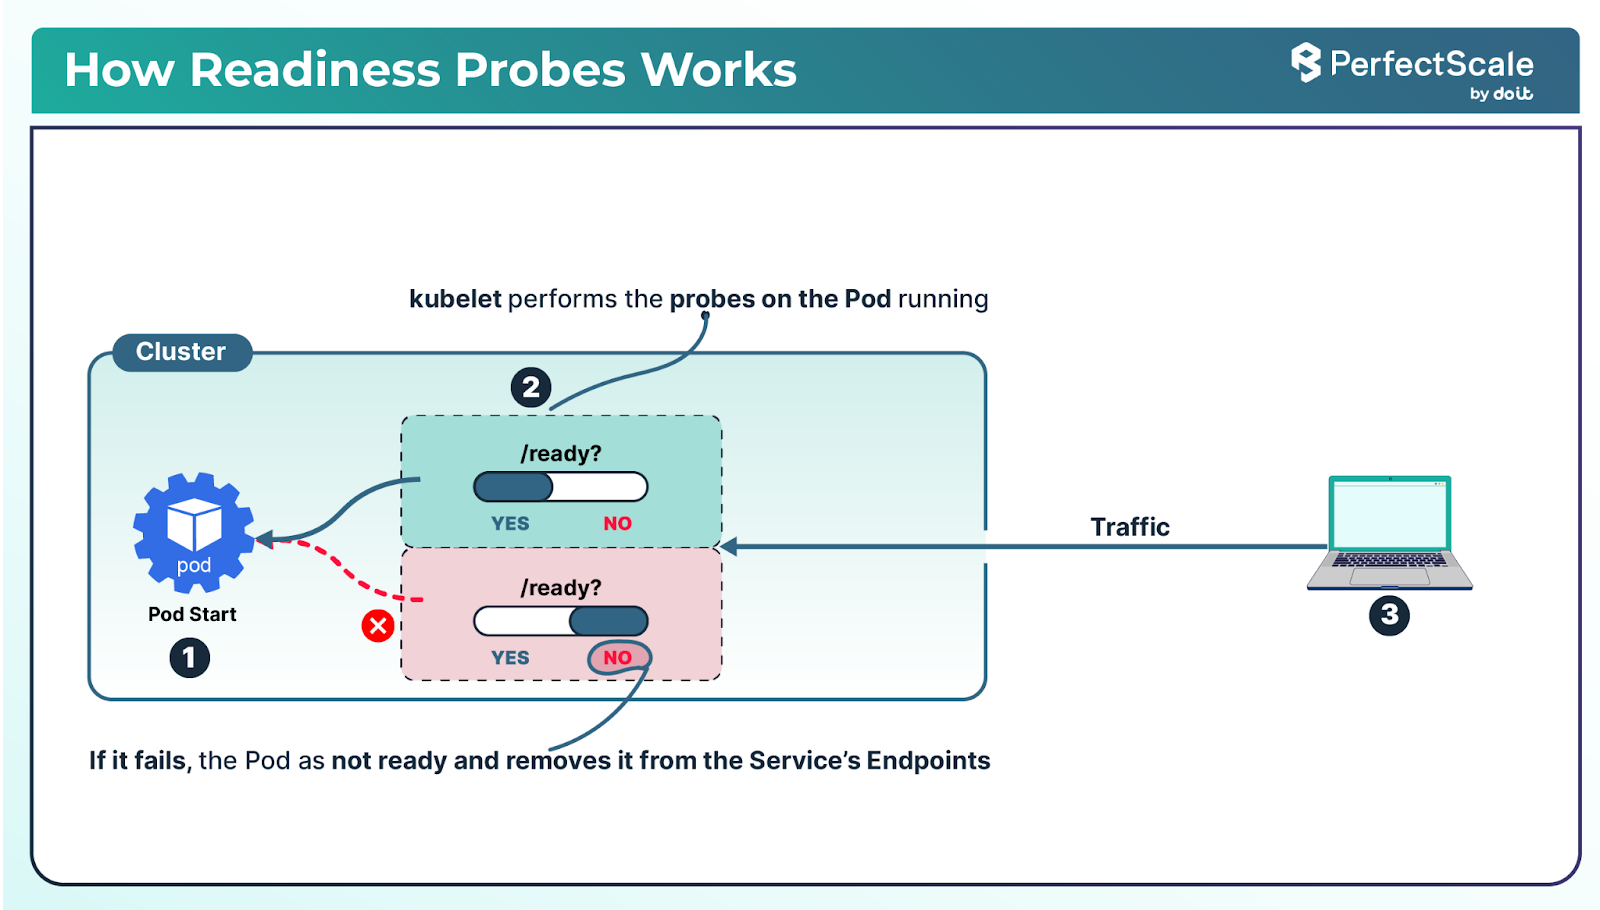
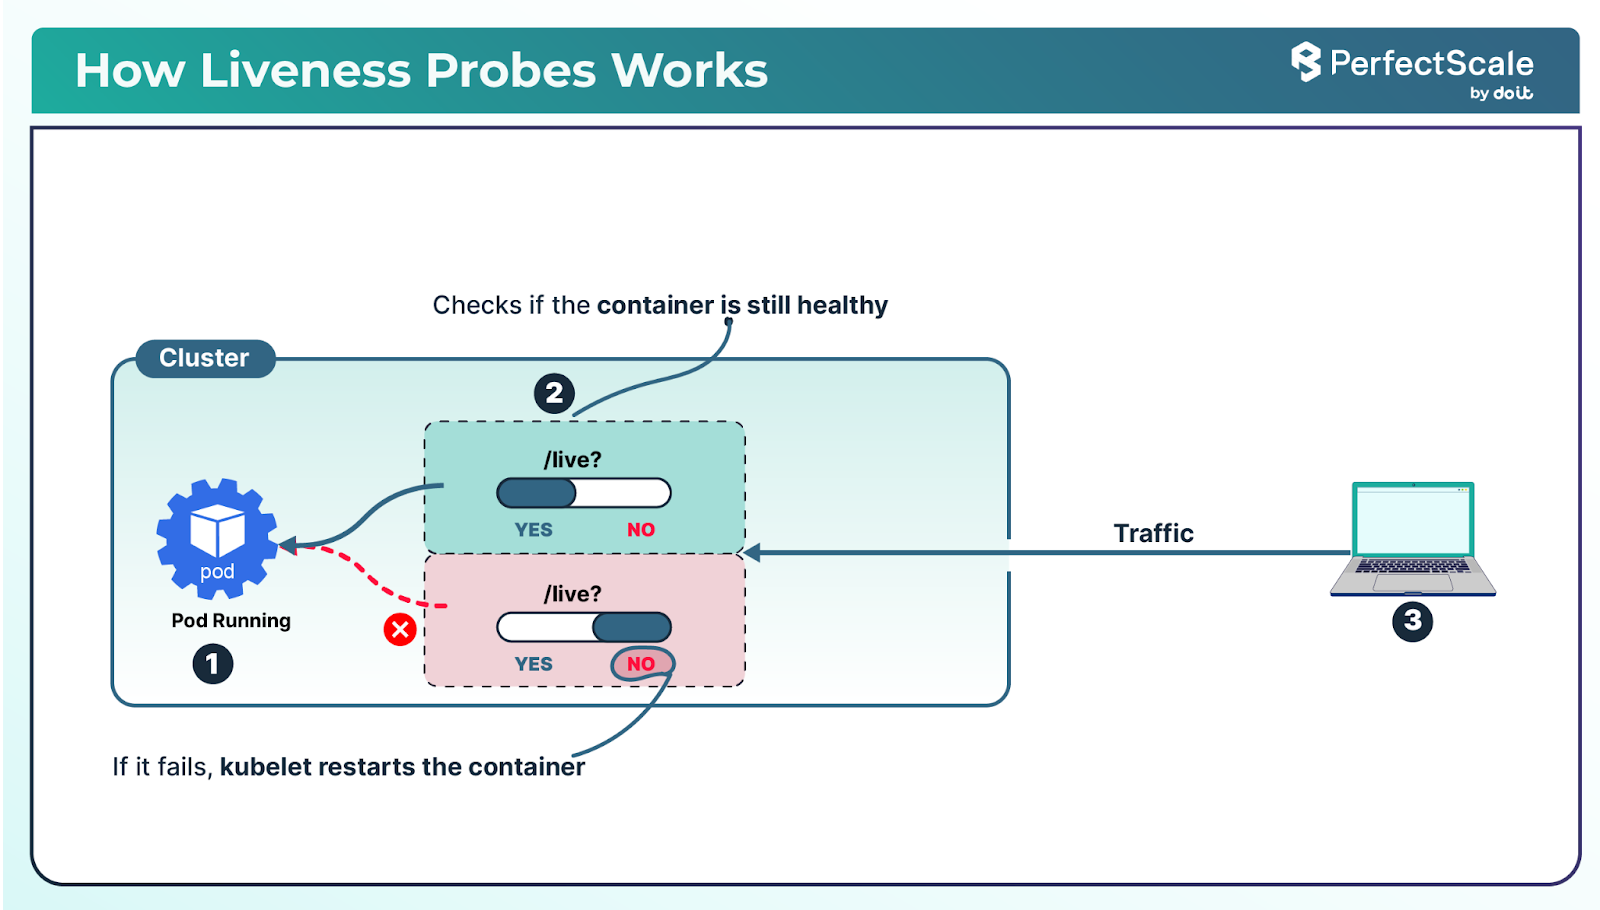
a. Implement Readiness and Liveness Probes
Readiness Probes: Determine if a container is ready to accept traffic. If the readiness probe fails, the container is removed from the service's endpoints, preventing it from receiving traffic until it becomes ready again. This is crucial during startup or when the application needs to perform initial tasks like loading configurations or establishing database connections. Strong readiness handling contributes to Kubernetes reliability in production environments.
Liveness Probes: It checks if a container is still running. If the liveness probe fails, Kubernetes restarts the container. This helps in recovering from situations where the application is running but is stuck or in a non-responsive state.
Startup Probes: It is useful for applications that take a long time to start. They disable liveness and readiness checks until the startup probe succeeds, preventing premature restarts and supporting Kubernetes reliability for slow-starting applications.
b. Configure Probes Correctly
Probe Types: Choose the appropriate probe type- HTTP, TCP, or command execution- based on the application's behavior.
Timing Parameters: Set initialDelaySeconds, periodSeconds, timeoutSeconds, successThreshold, and failureThreshold appropriately to balance sensitivity and stability. For example, setting a high failureThreshold can prevent unnecessary restarts for transient issues. Proper timing ensures better Kubernetes reliability.
Avoid Shared Endpoints: Ensure that the endpoints used for probes are not shared with critical application functionality to prevent false positives or negatives.
c. Monitor and Adjust
Regularly monitor probe results and application logs to fine-tune probe configurations. Tools like Prometheus and Grafana can be integrated for visualization and alerting.This ongoing feedback loop is essential to maintaining Kubernetes reliability.
Efficient resource management ensures that applications have the necessary resources to function correctly without overcommitting cluster capacity.
a. Define Resource Requests and Limits
Requests: Specify the minimum amount of CPU and memory resources required for the container. Kubernetes uses this to schedule pods on nodes that have sufficient resources.
Limits: Set the maximum amount of resources a container can use. This prevents a single container from consuming all the resources on a node, which could affect other applications.
You should start with conservative estimates based on application profiling and adjust over time. The tools, like Goldilocks, can provide recommendations for optimal resource settings.
b. Implement Autoscaling
Horizontal Pod Autoscaler (HPA): It automatically scales the number of pod replicas based on observed CPU utilization or other select metrics. This helps in handling varying loads efficiently.
Vertical Pod Autoscaler (VPA): It adjusts the resource requests and limits of containers based on usage. VPA can recommend or automatically apply changes, but care should be taken as it can cause pod restarts.
Note: You can manually resize resources in-place, see here.

Combine with Monitoring: Use monitoring tools to observe application performance and resource usage, ensuring that autoscaling configurations align with actual needs.
c. Avoid Resource Contention
Ensure that resource limits are not set too low, which could lead to throttling, or too high, which could waste resources. Regularly review and adjust settings based on application behavior and performance metrics.
Handling application termination gracefully ensures that in-flight requests are completed, and resources are released properly, maintaining application stability and user experience.
a. Handle SIGTERM Signals
Kubernetes sends a SIGTERM signal to containers before terminating them. Applications should listen for this signal and initiate a graceful shutdown process, such as closing database connections and completing ongoing requests.
import signal
import sys
import time

def handle_sigterm(signum, frame):
    print("SIGTERM received. Cleaning up...")
    # Close DB connections, finish tasks, etc.
    sys.exit(0)

signal.signal(signal.SIGTERM, handle_sigterm)

print("App running. Waiting for SIGTERM...")
while True:
    time.sleep(1)
b. Configure PreStop Hooks
Use the preStop lifecycle hook to perform tasks before the container is terminated. This can include notifying other services, flushing logs, or any cleanup operations.
lifecycle:
      preStop:
        exec:
          command: ["/bin/sh", "-c", "/home/stop.sh"]
c. Set Appropriate Termination Grace Period
Define terminationGracePeriodSeconds in the pod specification to give the application sufficient time to shut down gracefully. The default is 30 seconds, but this can be adjusted based on application needs.
spec:
  terminationGracePeriodSeconds: 60
d. Update Readiness Probes During Shutdown
Upon receiving a termination signal, the application should fail its readiness probe. This ensures that the pod is removed from service endpoints and stops receiving new traffic, allowing it to focus on completing ongoing requests.
e. Monitor and Test Shutdown Behavior
Regularly test the application's shutdown process to ensure it behaves as expected. Monitor logs and metrics to detect any issues during termination and adjust configurations accordingly.
Securing a Kubernetes environment requires a multi-layered approach, encompassing authentication, authorization, pod security, and image integrity.
a. Implement Role-Based Access Control (RBAC)
RBAC is fundamental in managing permissions within Kubernetes. By defining roles and binding them to users or service accounts, you can enforce the principle of least privilege, ensuring entities have only the access necessary for their functions. Regularly audit these roles and bindings to prevent privilege escalation and unauthorized access.
b. Integrate with External Identity Providers
For centralized and scalable authentication, integrate Kubernetes with external identity providers like LDAP, Active Directory, or OAuth2. This facilitates unified access management and simplifies user provisioning and deprovisioning.
a. Enforce Pod Security Standards
Apply Pod Security Standards (restricted, baseline, privileged) to define acceptable security configurations for pods. This helps in preventing the deployment of pods with insecure settings.
b. Run Containers as Non-Root Users
Configure containers to run as non-root users by setting the runAsUser and runAsNonRoot fields in the pod security context. Running as non-root reduces the risk of privilege escalation within containers.
spec:
  securityContext:
    runAsNonRoot: true   # Ensures no containers run as UID 0(root)
    runAsUser: 1000           # All containers run with UID 1000
    runAsGroup: 3000          # Primary GID for processes
c. Minimize Privileges
Avoid granting unnecessary capabilities to containers. Use the capDrop field to drop all capabilities and add only those that are essential. Also, set readOnlyRootFilesystem to true to prevent modifications to the container's filesystem.
a. Use Trusted Image Registries
Pull images from reputable and secure registries. Avoid using images from unknown sources, as they may contain vulnerabilities or malicious code.
b. Scan Images for Vulnerabilities
Implement image scanning tools (e.g., Clair, Trivy) in your CI/CD pipeline to detect known vulnerabilities before deployment. Regular scanning ensures that only secure images are promoted to production.
c. Keep Images Up-to-Date
Regularly update base images and rebuild application images to incorporate security patches. Outdated images may contain unpatched vulnerabilities that can be exploited.
Implementing progressive delivery techniques allows for controlled and gradual deployment of application updates, minimizing risks and ensuring system stability.
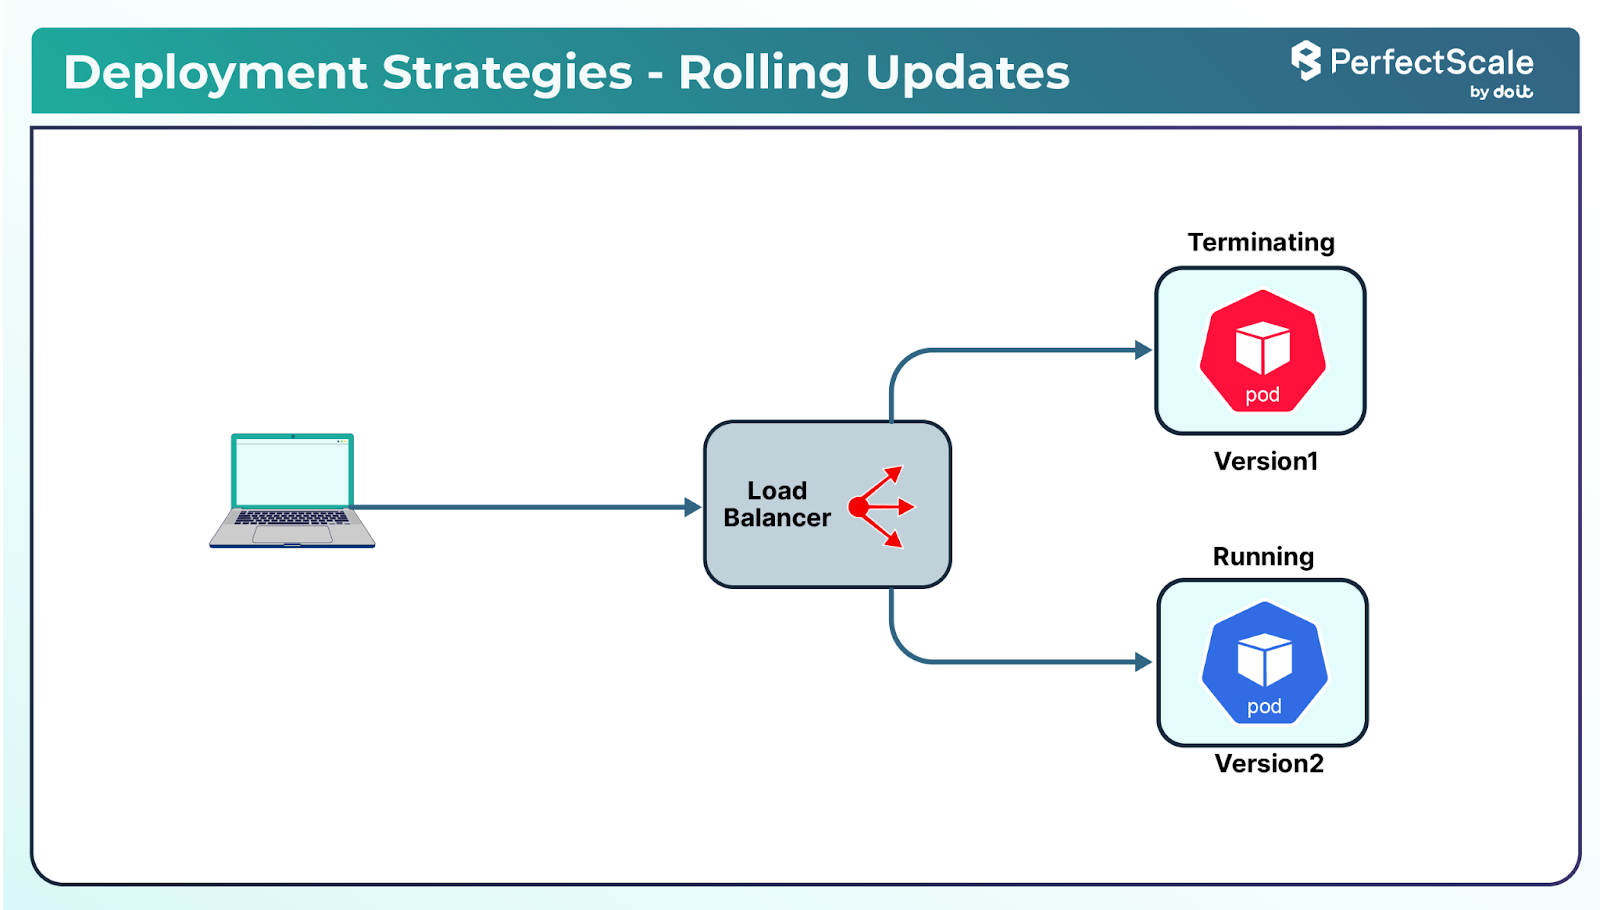
a. Rolling Updates
Rolling updates replace pods incrementally, ensuring that a portion of the application remains available during the update process. This strategy is beneficial for maintaining uptime but requires careful monitoring to detect any issues promptly.
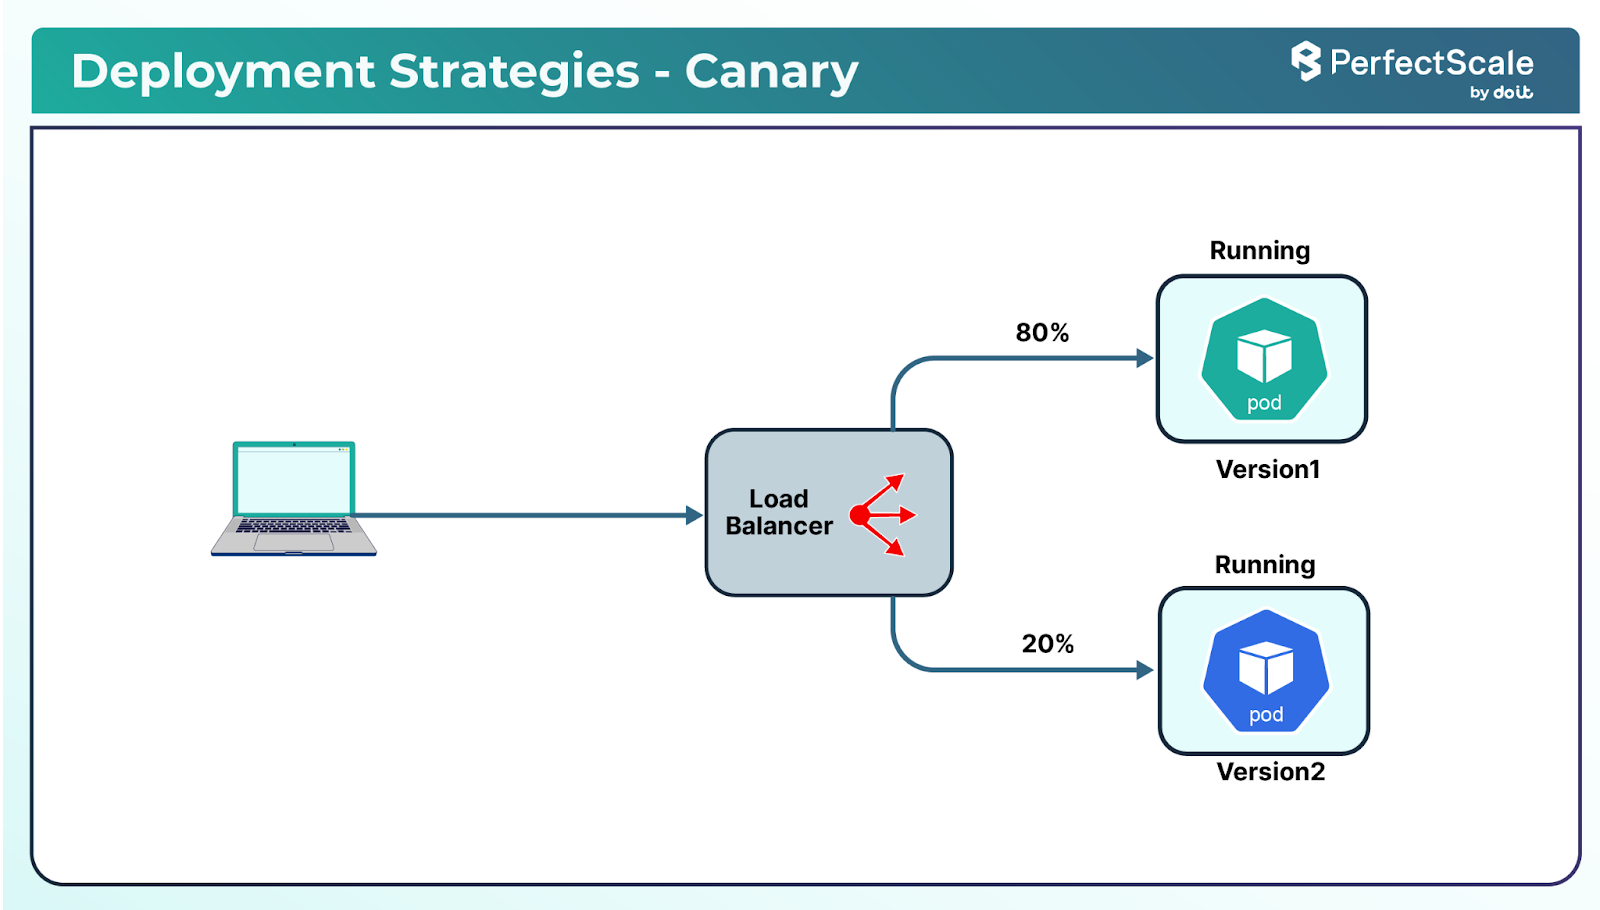
Canary deployments introduce new versions to a subset of users before a full rollout. This approach allows teams to observe the performance and stability of the new release in a real-world environment, facilitating early detection of potential problems.
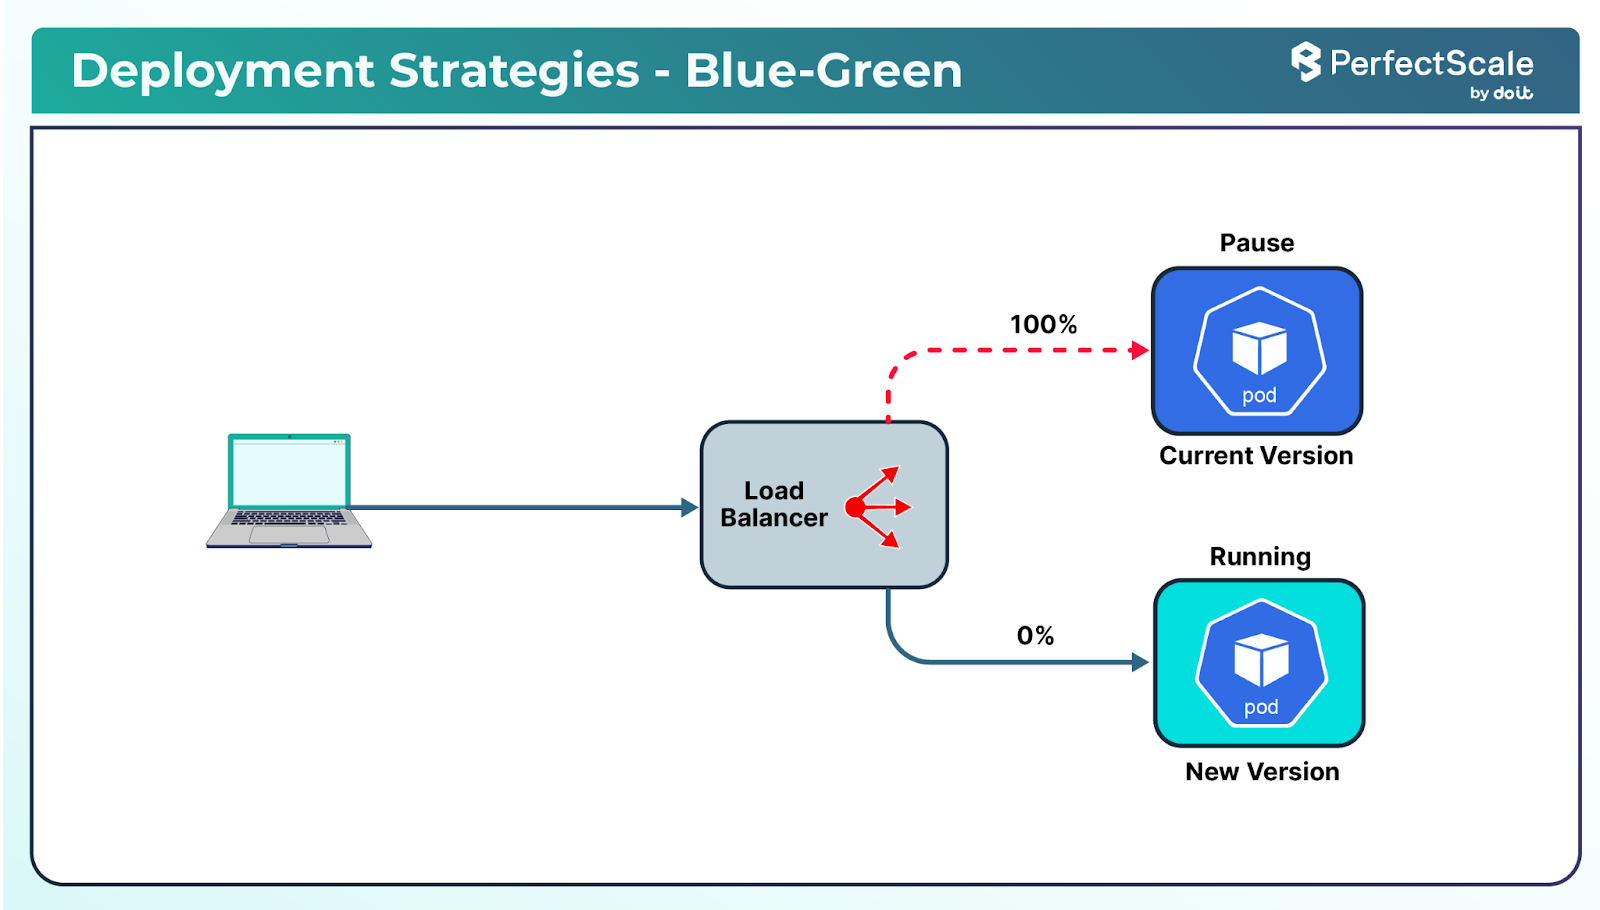
Blue-green deployments involve maintaining two separate environments: one for the current production version (blue) and one for the new version (green). Traffic is switched to the green environment once it's fully tested and deemed stable, allowing for quick rollback if necessary.
Regardless of the deployment strategy, it's crucial to implement robust monitoring to detect anomalies. Using tools like Prometheus and Grafana can provide insights into application performance. In case of issues, having automated rollback mechanisms ensures rapid recovery to a stable state.
Effective configuration management ensures that applications behave consistently across different environments and simplifies maintenance.
a. Use ConfigMaps and Secrets
Store non-sensitive configuration data in ConfigMaps and sensitive information in Secrets. This separation enhances security and allows for dynamic configuration changes without rebuilding application images.
b. Avoid Hardcoding Configurations
Hardcoding configurations can lead to inflexibility and security vulnerabilities. Instead, externalize configurations to allow for easier updates and better separation of concerns.
c. Implement Configuration Validation
Before deploying configurations, validate them to prevent misconfigurations that could lead to application failures. The tools, like kubeconform or Kubernetes' built-in validation mechanisms can assist in this process.
Maintaining version control over your deployments ensures traceability, facilitates collaboration, and supports rollback capabilities.
a. Adopt GitOps Practices
GitOps involves using Git repositories as the single source of truth for declarative infrastructure and application configurations. You can use tools like Argo CD or Flux to automate the synchronization between Git repositories and Kubernetes clusters, promoting consistency and reliability.
b. Tag and Document Releases
You should consistently tag releases in your version control system and maintain comprehensive documentation. This practice helps in tracking changes, understanding the history of deployments, and simplifying the rollback process if needed.
c. Integrate Continuous Integration/Continuous Deployment (CI/CD)
Implement CI/CD pipelines to automate the build, test, and deployment processes. Automation reduces manual errors, accelerates deployment cycles, and ensures that applications are consistently delivered with high quality.
Effective monitoring and observability are crucial for maintaining the health, performance, and reliability of Kubernetes clusters. They enable proactive issue detection, efficient troubleshooting, and informed decision-making.
a. Centralized Logging
Implementing a centralized logging solution allows for the aggregation and analysis of logs from all components within the cluster. The tools like the ELK (Elasticsearch, Logstash, Kibana) or EFK (Elasticsearch, Fluentd, Kibana) stacks are commonly used for this purpose. They facilitate real-time log collection, storage, and visualization, aiding in swift issue identification and resolution.
b. Metrics Collection and Visualization
Prometheus is a powerful tool for collecting metrics from Kubernetes clusters. It scrapes metrics from configured endpoints and stores them for analysis. Grafana complements Prometheus by providing rich visualization capabilities, enabling the creation of dashboards that display real-time metrics such as CPU usage, memory consumption, and request rates.
You should also ensure that logs and metrics are properly labeled with metadata like pod name, namespace, and application name to facilitate filtering and analysis.
You should also define appropriate retention policies for logs and metrics to balance storage costs with the need for historical data. Lastly, secure access to logging and metrics systems to prevent unauthorized data access.
a. Setting Up Alerts
Alerts are essential for notifying teams about issues that require immediate attention. Using Prometheus Alertmanager, you can define alerting rules based on specific conditions, such as high CPU usage or pod restarts. These alerts can be routed to various notification channels like email, Slack, or PagerDuty.
b. Avoiding Alert Fatigue
To prevent alert fatigue, it's crucial to fine-tune alert thresholds and avoid redundant or non-actionable alerts. Implementing severity levels and grouping related alerts can help prioritize responses and reduce noise.
You should regularly test alerting mechanisms to ensure they function as expected and define escalation policies to ensure critical alerts are addressed promptly.
a. Distributed Tracing
In microservices architectures, tracing requests across services is vital for understanding system behavior and diagnosing performance issues. Tools like Jaeger and OpenTelemetry provide distributed tracing capabilities, allowing you to track requests as they propagate through various services.
b. Analyzing Traces
By analyzing traces, you can identify bottlenecks, latency issues, and errors within your services. This insight is invaluable for optimizing performance and enhancing user experience.
Resilience and availability of applications in Kubernetes requires a robust disaster recovery and backup strategy. A solid approach to backups directly supports Kubernetes reliability.
Applications store critical data in persistent volumes (PVs). Regularly backing up these volumes is essential to prevent data loss due to hardware failures, accidental deletions, or other disruptions.
Backup Frequency: Determine an appropriate backup schedule based on the data's criticality and update frequency. For example, databases with frequent transactions may require hourly backups, while less dynamic data might suffice with daily backups.
Backup Tools: You can utilize tools like Velero, which can back up Kubernetes resources and persistent volumes, or integrate with cloud provider-specific backup solutions that strengthen Kubernetes reliability.
Regularly test the restoration of backups to ensure data integrity and the effectiveness of the backup process. This practice helps identify potential issues before an actual disaster occurs.
Restoration Drills: Conduct periodic drills where backups are restored in a staging environment to validate the process and train the team.
Documentation: Maintain clear documentation of the restoration procedures, including step-by-step instructions and contact points for support.
etcd is the key-value store that holds the state of the Kubernetes cluster. Regular backups of etcd are crucial for recovering the cluster's configuration and state in case of failures.
Backup Scheduling: Implement automated scripts or use tools to schedule regular etcd backups, ensuring minimal impact on cluster performance.
Consistency Checks: Periodically verify the consistency and integrity of etcd backups to ensure they are usable when needed.
Storing backups securely and in off-site locations protects against data loss due to site-specific disasters like fires or floods.
Encryption: Encrypt backups both at rest and during transit to prevent unauthorized access.
Offsite Storage Solutions: You should utilize cloud storage services or remote data centers to store backups, ensuring they are geographically separated from the primary cluster location.
A well-structured disaster recovery (DR) plan outlines the procedures to follow during various disaster scenarios, aiming to restore services promptly and minimize data loss.
Risk Assessment: Identify potential risks and their impact on the cluster to tailor the DR plan accordingly.
Recovery Objectives: Define Recovery Time Objectives (RTOs) and Recovery Point Objectives (RPOs) to set acceptable downtime and data loss thresholds.
Roles and Responsibilities: Assign specific roles to team members, detailing their responsibilities during a disaster event.
Regular drills simulate disaster scenarios, allowing the team to practice the DR plan and identify areas for improvement.
Simulation Exercises: Create realistic disaster scenarios, such as node failures or data breaches, to test the team's response and the effectiveness of the DR plan.
Post-Drill Reviews: After each drill, conduct a review session to discuss what went well and what needs enhancement, updating the DR plan as necessary.
Ensuring compliance and governance within Kubernetes clusters is important for maintaining security, meeting regulatory requirements, and managing resources effectively. Below are key practices to achieve robust compliance and governance.
Utilize Policy Enforcement Tools
Implement tools like Open Policy Agent (OPA), Gatekeeper to define and enforce policies across your Kubernetes clusters. These tools allow you to set rules that govern the behavior of resources, ensuring they adhere to organizational standards.
Define Clear Policies: Establish policies that cover aspects such as resource configurations, naming conventions, and security settings.
Automate Enforcement: Use admission controllers to automatically enforce policies during resource creation or modification, preventing non-compliant configurations from being applied.
Align your policies with industry regulations and standards relevant to your organization, such as GDPR, HIPAA, or PCI DSS. Regularly review and update policies to adapt to evolving compliance requirements.
a. Enable Comprehensive Audit Logs:
Activate Kubernetes audit logging to record all API server requests. These logs provide a detailed trail of actions taken within the cluster, which is essential for security audits and forensic investigations.
b. Regularly Review Logs
Implement processes to routinely analyze audit logs for unusual or unauthorized activities. Utilize log analysis tools to identify patterns or anomalies that may indicate security incidents.
a. Implement Resource Quotas
Define resource quotas to control the amount of CPU, memory, and other resources that can be consumed by different namespaces or teams. This prevents any single entity from monopolizing cluster resources, ensuring fair distribution and preventing resource exhaustion.
Set Appropriate Limits: Assess the needs of each team or application to set realistic and fair resource limits.
Monitor Usage: Continuously monitor resource consumption to ensure quotas are effective and adjust them as necessary to accommodate changing requirements.
b. Promote Efficient Resource Utilization
Encourage teams to optimize their applications for resource efficiency. Provide guidelines and tools to help identify and reduce unnecessary resource usage, contributing to overall cluster health and cost-effectiveness.
Continuous improvement is essential in maintaining a resilient and efficient Kubernetes environment. By regularly assessing and enhancing your systems, you can proactively address issues, optimize performance, and stay aligned with evolving best practices. Below are key strategies to foster continuous improvement in your Kubernetes operations.
After any incident, it's crucial to perform a postmortem analysis to understand the root causes and prevent future occurrences. Adopting a blameless approach encourages open communication and learning, focusing on systemic issues rather than individual faults.
Create a Detailed Timeline: Document the sequence of events leading up to the incident, including system behaviors and team responses.
Identify Contributing Factors: Analyze technical failures, process gaps, and communication breakdowns that contributed to the incident.
Implement Preventive Measures: Develop action plans to address identified issues, such as updating documentation, refining processes, or enhancing monitoring systems.
To ensure your applications can handle production traffic, it's essential to conduct performance testing. This involves simulating various load scenarios to identify potential bottlenecks and optimize resource utilization.
Utilize Load Testing Tools: Leverage tools like k6, JMeter, or Vegeta to simulate user traffic and measure system performance under stress.
Monitor Key Metrics: Track metrics such as response times, error rates, and resource usage to assess application behavior during tests.
Optimize Based on Results: Analyze test outcomes to identify areas for improvement, such as scaling configurations, code optimizations, or infrastructure enhancements.
Staying current with Kubernetes releases and associated tools is vital for security, stability, and access to new features.
Monitor Release Cycles: Kubernetes follows a regular release schedule. Stay informed about upcoming versions and plan upgrades accordingly.
Apply Security Patches Promptly: Regularly update your clusters to incorporate the latest security patches and vulnerability fixes.
Engage with the Community: Participate in Kubernetes forums, mailing lists, and community discussions to stay abreast of best practices and emerging trends.
Managing Kubernetes in production is an ongoing journey that demands diligence, adaptability, and a proactive mindset. By systematically addressing each area outlined in this checklist, organizations can harness the full potential of Kubernetes, delivering scalable and reliable applications.
As you wrap up your checklist for resilient Kubernetes applications, consider how PerfectScale can help you take the next step. It's lightweight agent plugs right into any Kubernetes environment, whether it’s GKE, EKS, AKS, KOPS, private cloud, or on-prem, so you can start getting cluster-wide reports on performance, cost, and resiliency within minutes of setup. PerfectScale spots up to 30 types of resilience risks, ranks them by impact, and shows practical steps to fix them, all without guesswork. Plus, it automatically adjusts CPU and memory to match actual usage, making sure you're not overspending on idle resources while maintaining high availability. You can even set alerts for resilience issues or cost spikes and feed them into tools like Slack, Datadog, or Jira so your team stays ahead of surprises. Sign up and Book a demo Today with the team!


Install in minutes and instantly receive actionable intelligence.


.png)