


Many Kubernetes clusters reserve far more CPU and memory than their pods use. A common cause is the startup of a Java service. A JVM needs a lot of CPU in its first seconds, so teams set a high request to protect that moment. The request then stays high for the whole life of the pod, long after the startup work ends.
The cloud bill follows the reservation, not the use. A pod that reserves 2 CPUs but uses a small part of them still blocks 2 CPUs on its node. Across many replicas, this unused reservation becomes a large part of the cost of a cluster.
The obvious fix is to lower the requests, but this fix is also risky. If you lower a request and leave the startup problem in place, the JVM starts slowly, probes fail, and the autoscaler adds replicas that the service does not need. Cost and reliability pull in opposite directions. This article explains why requests grow, what they cost, and how they affect scheduling and node scaling. It then shows how to find them and how to fix them without hurting reliability.
What Are Overinflated Resource Requests?
A resource request is the amount of CPU or memory that Kubernetes reserves for a container. The scheduler adds up the requests on each node, and it keeps the total below the allocatable resources of the node.
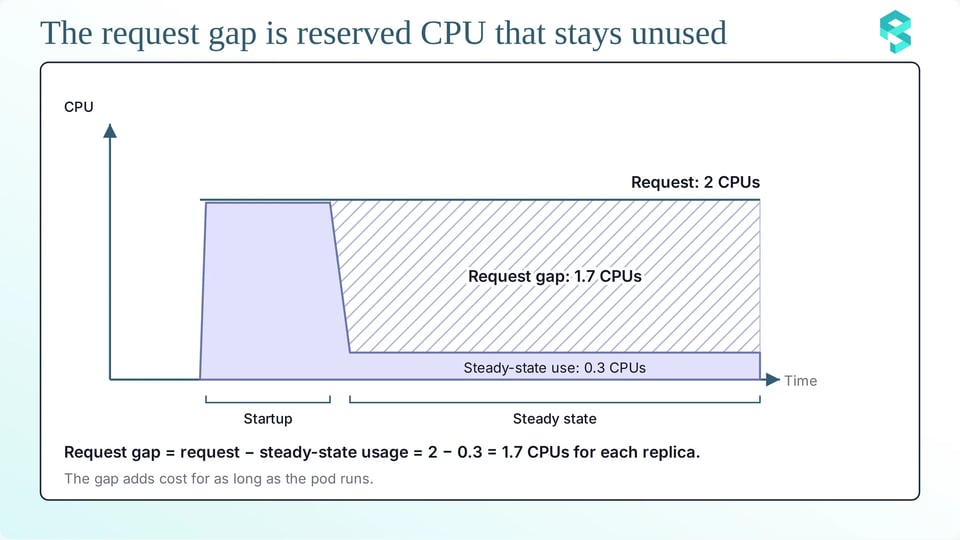
A request is overinflated when it is much larger than what the container needs in normal operation. We call the difference the request gap: the request minus the steady-state usage of the container.
resources: requests: cpu: "2" # sized for the first seconds of startup memory: 4Gi limits: cpu: "2" memory: 4GiIn this example, the request matches the startup peak. If the container needs only a small part of this CPU after startup, the rest of the reservation is the request gap.
CPU and memory behave differently. The kernel can slow a container that wants more CPU, but it cannot slow a container that wants more memory. When a container uses more memory than its limit, the kernel stops it with an out-of-memory (OOM) kill. For this reason, a CPU request has more room for careful tuning than a memory request.
Why Requests Get Inflated?
The requests grow for three reasons:
a. Sizing for the startup peak: A JVM loads classes, compiles hot methods with the JIT compilers, grows its heap, and builds the application, all in the first seconds. This work needs far more CPU than the service needs later. If the CPU limit is low, the kernel throttles the JVM, and startup becomes slow. A team that has seen this problem raises the request and the limit until startup works. The new value fits the startup peak, but it does not fit the rest of the pod lifetime. To see how the kernel throttles a JVM at startup, read CPU throttling during JVM startup.
b. Safety over cost: The two risks are not equal. When a service is throttled or killed, an alert fires, and someone must fix it. When a service wastes CPU, nothing fires, because Kubernetes does not report unused requests as an error. Engineers therefore choose the value that protects them from pages, and a high request is the safest choice.
c. Copied defaults: Many requests are not chosen at all. A Helm chart ships with default values, a team copies the manifest of another service, and an old template carries the numbers of a heavy service into a light one. A LimitRange can also set a default request for every container that has none:
apiVersion: v1kind: LimitRangemetadata: name: default-requests namespace: examplespec: limits: - type: Container defaultRequest: cpu: "1" memory: 2GiThis LimitRange gives a request of 1 CPU and 2Gi of memory to every container in the namespace that sets no request. These values spread across teams and environments, and nobody checks them again.

The Cost of Overinflated Requests
There are three steps that show the cost:
a. The request gap formula: The waste of a container has a simple formula:
waste (vCPU-hours): (request - steady-state usage) x replicas x hourscost: waste x price per vCPU-hourUse the same formula for memory with GiB-hours. For the steady-state usage, choose a high percentile of the usage after startup, such as the 95th. A percentile is safer than the average, because it covers normal peaks.
The way the gap becomes money depends on your platform. On standard nodes, you pay for the virtual machines, so the request gap raises the number of nodes that the cluster needs. On GKE Autopilot, Google bills for the CPU and memory that your pods request, so each unit of request gap is a direct cost.
b. Worked example: Suppose a Java service runs 100 replicas. Each replica requests 2 CPUs so that startup works. After startup, a replica needs about 0.3 CPUs at the 95th percentile. These numbers are an example, and your service has its own.
- The request gap is 2 - 0.3 = 1.7 CPUs for each replica.
- For 100 replicas, the gap is 170 CPUs that are reserved and not used.
- A month has about 730 hours, so the waste is 170 x 730 = 124,100 vCPU-hours each month.
- Multiply this number by the price of one vCPU-hour on your platform to get the monthly cost.
For memory, a container that requests 4 GiB but needs 2 GiB at steady state wastes 2 GiB for every replica.
c. Cost across services: One service is easy to fix, but many services are harder. The same inflated value repeats across replicas, services, clusters, and environments. Staging and development clusters often copy the production requests, so they carry the same waste.
Requests also use up quota. A ResourceQuota limits the sum of requests in a namespace:
apiVersion: v1kind: ResourceQuotametadata: name: team-quota namespace: examplespec: hard: requests.cpu: "40" requests.memory: 80GiWith this quota, all pods in the namespace together can request 40 CPUs and 80Gi of memory. Inflated requests use this budget long before real usage does. Then the team asks for a larger quota, and the problem grows.
How Overinflated Requests Break Bin-Packing?
The requests affect scheduling and node scaling in three ways:
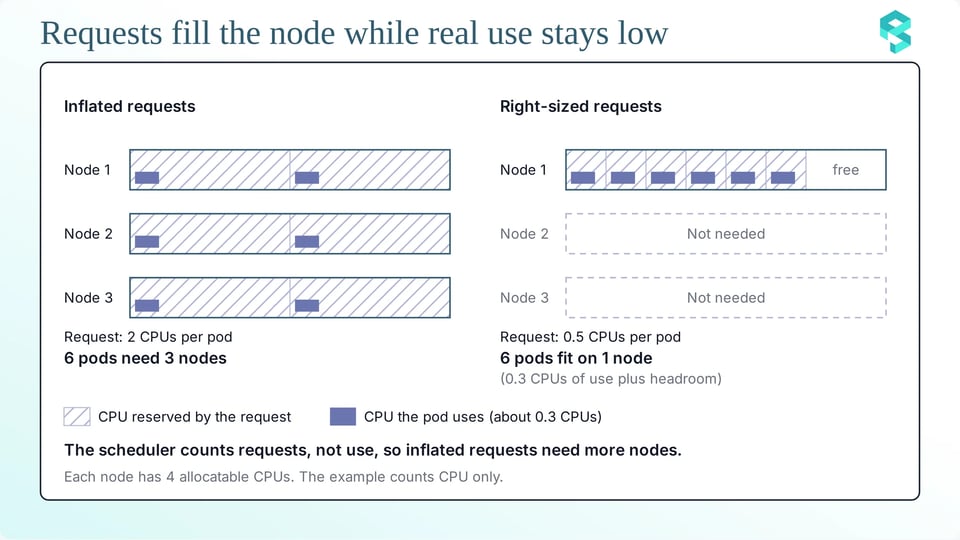
a. Scheduling uses requests, not usage: The scheduler does not look at what a pod uses. It looks at what the pod requests.
By default, the scheduler scores nodes with the LeastAllocated strategy. This strategy prefers nodes with fewer requested resources, so it spreads pods across nodes. The MostAllocated and RequestedToCapacityRatio strategies pack pods more tightly. All three strategies work on requests. A tighter strategy therefore cannot fix inflated requests, because it packs the reservations and not the real use.
b. Stranded CPU and extra nodes: Reserved CPU that no container uses is stranded. Other pods cannot use it because the scheduler counts it as taken. The cluster then needs more nodes to place the same pods. Mismatches make this worse. If requests are high for CPU and low for memory, a node runs out of CPU first, and its memory stays unused. The reverse also happens.
c. Effect on node autoscaling: Node autoscalers also work on requests. Cluster Autoscaler adds a node when a pod cannot be scheduled because of insufficient resources. To remove a node, it computes the utilization of the node as the sum of the requested resources divided by the allocatable resources. By default, a node becomes a candidate for removal only when this value is below 0.5 (--scale-down-utilization-threshold). Inflated requests keep the value high, so nodes with low real use stay in the cluster.
Karpenter follows the same idea. It reads the resource requests of pending pods to choose and launch nodes, and its consolidation packs pods based on requests, not on usage. Lower and more accurate requests let both tools run fewer nodes.
Why Average-Based Recommendations Fail Startup-Heavy Workloads?
Many tools recommend a request from the usage history of a container. They choose one statistic over a time window: the average, a percentile, or the peak. For a service with a startup peak, each choice fails in a different way:
a. A low statistic hides the peak: The average fits the steady state, so the recommended request is low. The JVM then gets too little CPU at startup, and the kernel throttles it.
b. A high statistic includes the peak: The maximum, or a very high percentile, includes the startup samples, so the recommended request fits startup. The pod then reserves startup-level CPU for its whole life, and the waste stays.
Both results are wrong for one of the phases. The size of the error also depends on how often pods start. Frequent deployments, autoscaling, and node replacements add more startup samples to the window, so the statistic moves toward the peak. A single number cannot describe a workload with two phases. The fix needs a recommendation or a mechanism that treats startup and steady state separately.
Risks of Cutting Requests Without Fixing Startup
A lower request without a startup fix causes three problems:
a. Throttling and slow readiness: If you lower the CPU limit together with the request, the kernel throttles the JVM at startup. The pod becomes Ready late, rollouts take longer, and the startup probe can fail. If the failure repeats, the kubelet restarts the container, and the new container repeats the same work. If you lower only the request and keep a high limit or no limit, the pod gets a smaller CPU share when the node is busy, so startup is slow on busy nodes.
b. HPA scale-out from startup CPU: The Horizontal Pod Autoscaler (HPA) measures CPU use as a percentage of the request. It uses this formula:
desiredReplicas = ceil[ currentReplicas x ( currentMetricValue / desiredMetricValue ) ]A smaller request makes the same CPU use look larger as a percentage. A startup peak can therefore look like heavy load, and the HPA adds replicas. New replicas start, and each start creates another peak. By default, the initial readiness delay is 30 seconds (--horizontal-pod-autoscaler-initial-readiness-delay), and the HPA might skip CPU samples during the CPU initialization period of 5 minutes (--horizontal-pod-autoscaler-cpu-initialization-period). These defaults reduce the risk, but they cannot remove it when startup is long.
c. OOMKilled Java containers: By default, the JVM sets its maximum heap to 25% of the container memory (-XX:MaxRAMPercentage). A JVM also uses memory outside the heap, such as metaspace, thread stacks, and the code cache. If you lower the memory limit without checking these parts, the container can exceed it and get an OOM kill.
If the memory request is lower than the limit, the node can also place too many pods on it, and the kubelet can evict pods when the node runs low on memory. For JVM containers, set the memory request equal to the memory limit:
resources: requests: memory: 2Gi limits: memory: 2Gi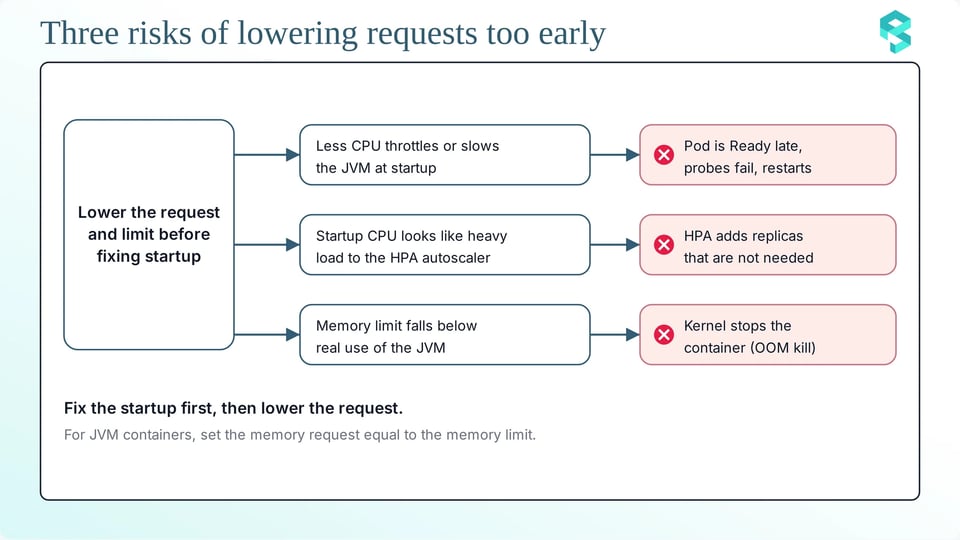
How to Find Overinflated Requests
There are three checks that will help you find the problem:
a. Requests vs. usage: For a first look, use kubectl top. It needs the Metrics Server, and it shows current usage for each container:
kubectl top pod --containers -n <namespace>Compare the result with the requests in the pod spec. For a full picture, use Prometheus. The metric kube_pod_container_resource_requests from kube-state-metrics holds the requests. The cAdvisor metric container_cpu_usage_seconds_total holds the CPU use. This query shows the CPU request gap for each container, using the 95th percentile of usage over 7 days:
expr: | sum by (namespace, pod, container) ( kube_pod_container_resource_requests{resource="cpu", container!=""} ) - max by (namespace, pod, container) ( quantile_over_time(0.95, rate(container_cpu_usage_seconds_total{container!~"POD|"}[5m])[7d:5m] ) )b. Startup window vs. steady state: The request gap query mixes both phases, and the startup samples raise the 95th percentile, so the gap looks smaller than the true steady-state gap. To separate them, use the metric kube_pod_start_time, which holds the start time of each pod. This query keeps only the samples from the first 10 minutes of a pod and returns the peak:
max by (namespace, pod, container) ( max_over_time( ( rate(container_cpu_usage_seconds_total{container!~"POD|"}[1m]) and on (namespace, pod) (time() - kube_pod_start_time < 600) )[7d:1m] ))This query keeps only the samples after the first 10 minutes and returns the 95th percentile. It shows the steady state:
max by (namespace, pod, container) ( quantile_over_time(0.95, ( rate(container_cpu_usage_seconds_total{container!~"POD|"}[5m]) and on (namespace, pod) (time() - kube_pod_start_time > 600) )[7d:5m] ))These queries assume that startup ends within 10 minutes. Change 600 to the startup time of your service. The pod start time does not change when a container restarts inside the same pod, so such a restart counts as steady state. The startup query also uses a step of 1 minute, so it can read a little below the true peak when the peak is short.
Compare three values for one container: the request, the startup peak, and the steady-state usage. A container with a large gap between the request and the steady-state usage, and a startup peak close to the request, is a classic overinflated JVM service.
c. Ranking workloads by request gap: Fix the largest gaps first. Rank by the absolute gap in CPUs, summed over all replicas, and not by the ratio. A ratio of ten on a tiny container saves little. These queries are heavy, so store the gap in a recording rule and rank the result:
groups: - name: request-gap rules: - record: container:cpu_request_gap:cores expr: | clamp_min( sum by (namespace, pod, container) ( kube_pod_container_resource_requests{resource="cpu", container!=""} ) - max by (namespace, pod, container) ( quantile_over_time(0.95, rate(container_cpu_usage_seconds_total{container!~"POD|"}[5m])[7d:5m] ) ), 0)If you use the Prometheus Operator, put the same rule group under spec.groups of a PrometheusRule object, with the label that your Prometheus uses to select rules.
topk(20, sum by (namespace, container) (container:cpu_request_gap:cores))Do the same check for memory with the metric container_memory_working_set_bytes.
How to Stop Paying for Startup All Lifetime?
The goal is to give the pod startup-level resources at startup and steady-state resources after that. These options work together:
a. Reduce startup cost: Less startup work needs less CPU at startup, and this lowers the peak that sets the request. Spring Boot can create beans on first use with spring.main.lazy-initialization=true. Class Data Sharing and the AOT cache can remove part of the class loading work. The AOT cache arrived in JDK 24 (JEP 483). Spring Framework supports both CDS and the AOT cache. Profiling shows where your own startup time goes.
b. Startup boost and VPA: The Vertical Pod Autoscaler (VPA) has an InPlaceOrRecreate update mode. This mode tries an in-place resize first, and it recreates the pod when an in-place resize is not possible. On GKE, the CPU startup boost works with the VPA. It raises the CPU request when the pod is created, and it keeps the higher request for durationSeconds after the pod becomes Ready. Then GKE returns the request to its baseline value in place. The boost applies only when the pod is created, so a container restart inside the same pod gets no boost. The feature is in Preview at the time of writing, and it needs GKE 1.36.0-gke.4447000 or later.
apiVersion: autoscaling.k8s.io/v1kind: VerticalPodAutoscalermetadata: name: example-vpaspec: targetRef: apiVersion: apps/v1 kind: Deployment name: example updatePolicy: updateMode: "Off" startupBoost: cpu: type: "Factor" factor: 2 durationSeconds: 10In this example, the boost doubles the CPU request (factor: 2) and keeps it for 10 seconds after the pod becomes Ready. With updateMode set to Off, the VPA applies only the boost and makes no other changes. If you use an HPA with the boost, define a readiness probe and set durationSeconds to 0. This stops the HPA from adding replicas because of the CPU peak at startup.
c. Two-phase in-place resize: In-place pod resize changes the CPU and memory of a running pod without a restart. The feature reached beta in Kubernetes 1.33 and became stable in Kubernetes 1.35. A pod can start with a high CPU request and limit, and a controller can lower them after startup. The default resize policy for CPU is NotRequired, and you can state it in the manifest:
containers: - name: app resizePolicy: - resourceName: cpu restartPolicy: NotRequiredYou change the resources through the resize subresource. This command needs kubectl 1.32 or later:
kubectl patch pod <pod-name> --subresource resize --patch \ '{"spec":{"containers":[{"name":"app","resources":{"requests":{"cpu":"300m"},"limits":{"cpu":"500m"}}}]}}'This example assumes a Burstable pod, where the request is lower than the limit. A Guaranteed pod must keep the request equal to the limit, because a resize cannot change the QoS class. Windows pods and pods under the static CPU or Memory manager policy cannot use in-place resize. Someone must also trigger the resize. A person can run the patch by hand, but for many pods a controller must run it.
For JVM containers, resize only the CPU and leave the memory limit as it is, because a lower memory limit can cause an OOM kill.
d. startupProbe and HPA tuning: A startup probe stops the liveness and readiness probes until the application has started. It prevents restart loops during a slow start. Point it at the same endpoint as the liveness probe. The total time that the probe allows is failureThreshold x periodSeconds.
startupProbe: httpGet: path: /actuator/health/liveness port: 8080 periodSeconds: 5 failureThreshold: 24 # waits up to 24 x 5 = 120 secondsThis path needs the Spring Boot Actuator dependency. Spring Boot enables the liveness and readiness endpoints automatically when the application runs on Kubernetes. A startup probe does not make startup faster, but it makes a lower request safer.
The HPA also needs care. The behavior field of the autoscaling/v2 API limits how fast the HPA adds replicas, so a short startup peak does not cause a burst of new pods:
apiVersion: autoscaling/v2kind: HorizontalPodAutoscalermetadata: name: example-hpaspec: scaleTargetRef: apiVersion: apps/v1 kind: Deployment name: example minReplicas: 2 maxReplicas: 10 metrics: - type: Resource resource: name: cpu target: type: Utilization averageUtilization: 70 behavior: scaleUp: stabilizationWindowSeconds: 60 policies: - type: Pods value: 2 periodSeconds: 60In this example, the HPA targets 70 percent CPU use. The scale-up window of 60 seconds delays scale-up decisions, so a short startup peak does not add replicas. The HPA adds at most 2 pods in each 60-second period.
e. PerfectScale automation: PerfectScale fixes startup waste automatically. A JVM needs a lot of CPU only at startup. One average recommendation does not work for both phases. PerfectScale automatically detects services with high startup resource requirements and provides two recommendations for each workload: one for startup and one for steady-state runtime.
PerfectScale applies the startup recommendation when a pod is created, then adjusts resources in place to match the runtime recommendation once the pod reaches a steady state, helping you optimize resource allocation for both phases without compromising application performance. And no pod restart or manual intervention is needed. The pod no longer carries startup-level requests for its whole life. PerfectScale sizes the startup recommendation to the higher need of the two phases, so the node has enough capacity during startup. PerfectScale shows startup and steady-state resources separately, so the cost and waste numbers reflect what the workload needed in each phase. PerfectScale uses in-place resize when the cluster supports it. It supports Deployments, StatefulSets, DaemonSets, and Argo Rollouts. When the cluster does not support in-place resize, PerfectScale uses its standard safe approach instead.
PerfectScale also respects your JVM heap size limits, so recommendations never exceed your configured maximum heap size or fall below your configured minimum. For Java containersit collects heap and non-heap memory usage, along with garbage collection (GC) metrics, including GC time, active processor count, and GC type. JVM metrics collection can be enabled during PerfectScale agent installation, with no additional setup required. This feature is supported on Linux nodes only.
Node autoscalers benefit too. PerfectScale checks your Karpenter settings against the requests of running workloads, and it recommends right-sizing the workloads first. Then the Karpenter recommendations match real usage and not inflated requests.
A before and after for one service. This example uses the numbers from the worked example above. Before, the request fits the startup peak:
resources: requests: cpu: "2" memory: 2Gi limits: cpu: "2" memory: 2GiAfter, the request fits the steady state, the limit keeps headroom for startup, and a startup probe protects the slow start:
resources: requests: cpu: 300m memory: 2Gi limits: cpu: "2" memory: 2GistartupProbe: httpGet: path: /actuator/health/liveness port: 8080 periodSeconds: 5 failureThreshold: 24The reliability risk is that the node needs free CPU at startup, because the request is only 300m. Boost or resize the pod when the node may be busy.
Conclusion
Overinflated requests are easy to create and costly to keep. The scheduler, the node autoscalers, and some cloud bills follow requests and not usage, so every unused CPU in a request still costs money.
JVM startup is a common cause. The request fits the first seconds, and it stays for the whole life of the pod. Cutting the request alone does not solve this, because it causes throttling, extra HPA replicas, and OOM kills. Reduce the startup work first, or size the startup and the steady state separately. PerfectScale does this automatically, in place and without a restart.
Join the workshop. Vikram Seshadri from DoiT shows how to size a JVM pod for its startup, and how to resize it to steady state without a restart, in the hands-on workshop “Java on K8s: The Startup vs. Steady-State Sizing Dilemma” on October 28, 2026 at 11 AM ET. Save your seat.
Do you want to see how PerfectScale right-sizes your Java workloads? Start for free or book a demo.