
PerfectScale
How Do You Identify What Makes Your Service Expensive to Start?
Find why a Java service is slow or CPU-heavy to start using logs, JFR, and async-profiler, then turn findings into Kubernetes sizing decisions.
This page is also available in Deutsch, Español, Français, Italiano, 日本語, and Português.


A Java service can be expensive to start for many reasons. It may load many classes, compile code, build a large set of beans, wait for a database, or fill a cache. The cost shows up as a long time to Ready, high CPU use, or both.
Each reason needs a different fix. If you guess, you tune the wrong thing. More CPU does not help a service that waits for a database. A lower CPU limit makes a busy service slower while it compiles code.
You can find the real cause with measurements and a profile. Logs, Java Flight Recorder (JFR), and async-profiler each show a different part of startup. When you know the cause, you can choose CPU and memory settings that are safe for the service.
What Makes a Service Expensive to Start?
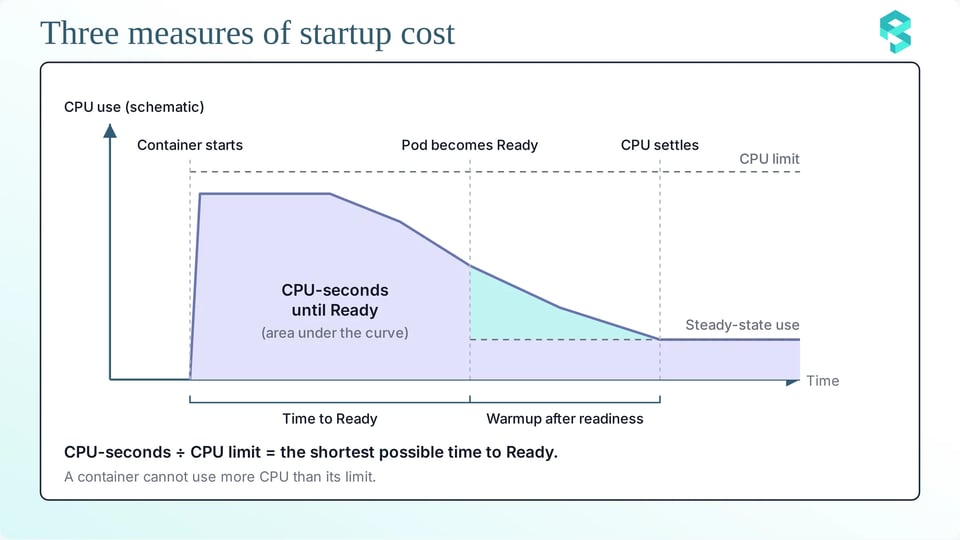
A service is expensive to start when it needs much time, much CPU, or both before it can serve traffic. Three measures describe the cost:
a. Time to Ready: Time to Ready is the time from the start of the container to the moment when the pod becomes Ready. A long time to Ready delays rollouts, slows scale-out, and raises the risk of failed probes. This command prints the two timestamps for the container named app:
kubectl get pod <pod-name> -o jsonpath='{.status.containerStatuses[?(@.name=="app")].state.running.startedAt}{"\n"}{.status.conditions[?(@.type=="Ready")].lastTransitionTime}{"\n"}'The difference between the two values is the time to Ready. The Spring Boot log line “Started ... in N seconds” gives a smaller number. It starts when the application starts, and it does not include the time that the JVM and the container need to start.
b. CPU-seconds until Ready: One CPU-second is one CPU working for one second. CPU-seconds until Ready is the total CPU work of startup. A container cannot use more CPU than its limit, so the CPU-seconds divided by the limit is the shortest possible time to Ready. On cgroup v2, read the field usage_usec as soon as the pod becomes Ready:
kubectl exec <pod-name> -c app -- cat /sys/fs/cgroup/cpu.statThe field usage_usec is the CPU time that the container has used since it started, in microseconds. Divide it by 1,000,000 to get CPU-seconds. The fields nr_throttled and throttled_usec in the same file show how much the kernel throttled the container. If you read the file late, the value includes work after Ready.
c. Warmup after readiness: Ready does not mean fast. When the pod becomes Ready, the JVM still runs many methods in the interpreter, which is slow, and the JIT compilers keep compiling in the background. During this warmup, the service uses more CPU than in the steady state, and the first requests can be slow. If you lower the resources at the moment of Ready, you can slow the warmup. You should measure the CPU use for several minutes after Ready, and not only until Ready.
Startup Profiling Tools
There are three tools to find the cause of an expensive startup. You can start with the cheapest one, and use the next tool only when you need more detail:
a. Logs and the Spring Boot startup endpoint: The Spring Boot log line “Started ... in N seconds” gives a first number. For more detail, the startup endpoint of Spring Boot Actuator lists each startup step with its duration. It needs a BufferingApplicationStartup in the application:
SpringApplication application = new SpringApplication(MyApplication.class);application.setApplicationStartup(new BufferingApplicationStartup(4096));application.run(args);The number 4096 is the capacity of the buffer, which is the maximum number of steps that it holds. Then expose the endpoint. Keep health in the list, so that your probes keep working:
management.endpoints.web.exposure.include=health,startupA GET request to /actuator/startup returns a snapshot of the steps. A POST request returns the steps and clears the buffer. Each step has a name, a duration, and tags such as the bean name. Check the longest steps first. Names such as spring.beans.instantiate, spring.context.config-classes.parse, and spring.context.refresh show where the time goes. For spring.beans.instantiate, the tag beanName names the bean, so you can find the slowest bean. The step names can change between Spring versions.
Two JVM log options add more data. The option -Xlog:gc* writes the garbage collection events, and the option -Xlog:class+load writes each class load. You can pass both in JAVA_TOOL_OPTIONS.
b. Java Flight Recorder (JFR): JFR is built into the JDK. It records events from the JVM, such as garbage collections, JIT compilations, and execution samples. The default settings add very little overhead, and the profile settings record more events. JFR starts with the JVM when you use the option -XX:StartFlightRecording, so it captures the whole startup. After you copy the file out of the pod, read it with the jfr tool of the JDK or with JDK Mission Control:
jfr summary startup.jfrjfr print --events jdk.GarbageCollection,jdk.Compilation startup.jfrjfr print --events jdk.ExecutionSample --stack-depth 8 startup.jfrThe first command lists the event types and their counts. The second command prints the garbage collection events and the JIT compilations with their durations. The third command prints samples of the code that the threads run, with a stack depth of 8 frames. The event jdk.Compilation records only compilations that take longer than the threshold of your settings.
c. async-profiler: async-profiler is a sampling profiler for Java, and it writes flame graphs. Two of its modes matter for startup. The cpu mode samples only the threads that use CPU, so it shows what consumes CPU. The wall mode samples all threads at a fixed interval, whether they run, sleep, or wait, so it shows where the time goes, including waits. async-profiler can start with the JVM as an agent, so it captures the first second.

Capturing a Startup Profile in Kubernetes
The recording must start with the JVM, and it must run under the real conditions of the service. Two points matter:
a. Profile under production CPU limits: Use the same image, the same JVM flags, and the same CPU and memory settings as in production. A different limit changes the startup itself. It changes the throttling, the CPU count that the JVM sees, and the collector that the JVM selects. A profile that you take without the production limit shows a different startup. For deep-dive, read CPU throttling during JVM startup.
This pod template starts JFR with the JVM and writes the file to a volume:
spec: template: spec: containers: - name: app image: registry.example.com/orders-service:1.8.0 env: - name: JAVA_TOOL_OPTIONS value: >- -XX:StartFlightRecording=filename=/profiles/startup-%p.jfr,settings=profile,duration=120s,dumponexit=true resources: requests: cpu: 300m memory: 2Gi limits: cpu: "2" memory: 2Gi volumeMounts: - name: profiles mountPath: /profiles volumes: - name: profiles emptyDir: sizeLimit: 500MiEach setting has one job:
filename=/profiles/startup-%p.jfrwrites the file to the volume. The text%pbecomes the process ID.settings=profilerecords more events than the default settings.duration=120sstops the recording after 120 seconds. Choose a time that covers the startup and several minutes of warmup.dumponexit=truewrites the file even if the JVM exits early, for example when a probe kills the container.emptyDirgives a writable folder even when the root file system is read-only. ThesizeLimitstops a large file from filling the disk of the node.- The CPU and memory values are examples. Use your production values.
In a container, the JVM is usually process 1, so the text %p becomes 1, and the file is named startup-1.jfr. If you want to keep the files of several runs in one volume, add %t to the file name. It adds a timestamp. Both JFR and async-profiler accept %t.
To use async-profiler, put libasyncProfiler.so in the image, or in a volume that an init container fills with the release archive of async-profiler. Then change the environment variable:
env: - name: JAVA_TOOL_OPTIONS value: >- -agentpath:/profiler/lib/libasyncProfiler.so=start,event=cpu,threads,timeout=120,file=/profiles/startup-cpu-%p.htmlThe agent options work like this: start begins profiling when the JVM starts, event=cpu selects the CPU mode, threads profiles each thread separately, timeout=120 stops after 120 seconds, and file=...html writes a flame graph. For a wall-clock profile, replace event=cpu with event=wall,interval=10ms. Containers often block perf events. If the profiler fails to start, use event=ctimer, which works without perf events.
Run one profiler in each run, and repeat each run three times. One run can mislead you.
b. Copying profiles out of the pod: Use kubectl cp to copy the folder to your computer:
kubectl cp <namespace>/<pod-name>:/profiles ./profiles -c appThe command needs the tar program in the container image. If the image has no tar, the command fails. In that case, mount the same volume in a small second container that has tar, and use its name with -c. Copy the files before the pod is removed, because Kubernetes deletes an emptyDir volume with the pod. Open an HTML file in a browser.
Reading a Startup Flame Graph
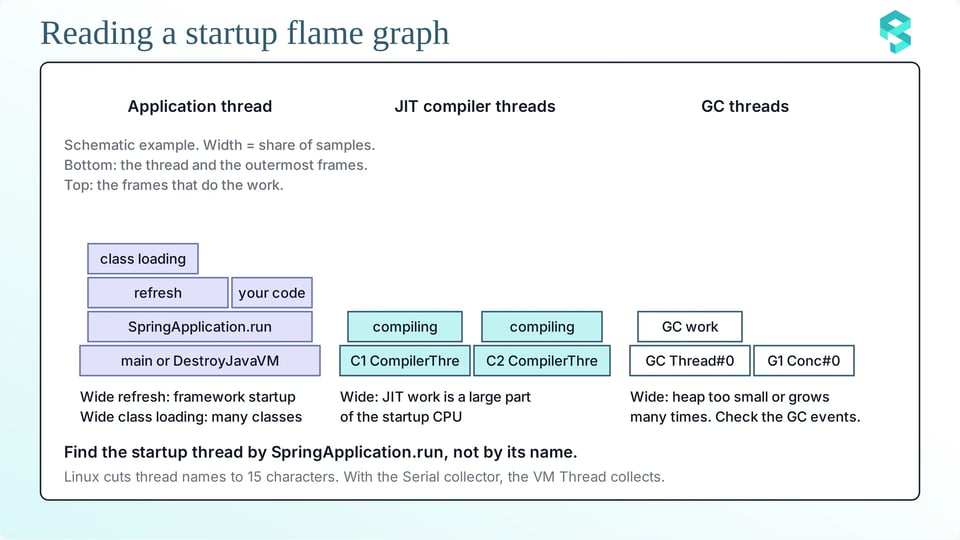
A flame graph shows the stack traces of all samples. Each box is a method, and its width is the share of the samples that include it. In an async-profiler graph, the outermost frames, such as main, are at the bottom, and the leaf frames, which do the work, are at the top. Wide boxes are where the time goes. Because of the threads option, each thread has its own tower, and the tower starts with a box that names the thread. Linux cuts thread names to 15 characters, so long names look shorter in the graph. Three groups of threads matter:
a. Application threads: The thread that runs main runs the startup code of the application. Its root box can be named main or DestroyJavaVM, so find it by the frame SpringApplication.run and not by its name. A wide SpringApplication.run tower, or a wide refresh tower, means that framework startup uses most of the time. Wide boxes with defineClass or loadClass mean class loading. Wide boxes with your own package names mean your own startup code, such as a cache load or a database migration.
b. JIT compiler threads: Roots that start with C1 CompilerThre and C2 CompilerThre are the JIT compilers. The full thread names are C1 CompilerThread0, C2 CompilerThread0, and so on. If these towers are as wide as the tower of the startup thread, JIT work is a large part of the startup CPU. To see which frames run in the interpreter, write the profile to a file with the extension .collapsed, and add the option ann. In that file, interpreted frames end with _[0], C1 frames with _[1], other compiled frames with _[j], and inlined frames with _[i]. Many _[0] frames in the startup thread mean that the code is not compiled yet. The HTML graph does not add these endings. It shows the frame types with colors.
c. GC threads: With G1, roots such as GC Thread#0, G1 Conc#0, and G1 Refine#0 do the garbage collection work. With the Serial collector, the VM Thread does it. A CPU limit of 1 CPU or less, or a memory limit below 1792 MB, makes the JVM select the Serial collector, so a graph from such a pod has no GC worker threads. A wide garbage collection tower in the first seconds means that the heap is too small for the allocation of startup, or that it grows many times. Confirm this with the jdk.GarbageCollection events of JFR, where the event name shows the collector (for example, DefNew and SerialOld belong to the Serial collector), or with the log option -Xlog:gc*.
Compare a cpu graph with a wall graph of the same startup. A wall graph also shows many idle threads, such as web server threads. Ignore them, and focus on the startup thread.
Common Startup Cost Categories
Most expensive startups fit one or more of five categories. In each category, the profile has a clear sign, and the sizing decision is different:
a. Framework-heavy applications: The sign is a wide tower under SpringApplication.run in the startup thread, many spring.beans.instantiate steps, and a lot of class loading. The work is CPU-bound, so a low CPU limit slows it directly. Spring Boot can create beans on first use with spring.main.lazy-initialization=true. Class Data Sharing and the AOT cache remove part of the class loading work. The AOT cache arrived in JDK 24 (JEP 483).
b. JIT-heavy workloads: The sign is wide C1 CompilerThre and C2 CompilerThre towers, and a CPU use that stays high after the pod becomes Ready. The AOT cache of JDK 25 can store method profiles from a training run (JEP 515). The JVM then needs less time to profile, and the JIT can start its work sooner. The JIT compilers still run, so warmup does not disappear.
c. GC and heap pressure: The sign is many garbage collection events in the first seconds, and wide GC towers. By default, the JVM starts with a small heap and grows it as the application allocates objects, and each growth step adds CPU work. You can set a larger initial heap with -XX:InitialRAMPercentage. A larger initial heap uses more memory from the start, so check the memory limit first. Keep the initial heap below the maximum heap, which is 25% of the container memory by default (-XX:MaxRAMPercentage).
d. I/O and dependency waits: The sign is a low CPU use and a long time to Ready. The wall graph shows the startup thread in socket reads, sleeps, or park calls. Typical causes are database connections, schema migrations, remote configuration, DNS lookups, and TLS handshakes.
e. Eager cache warming: The sign is application threads in your own cache-loading code, and a CPU and memory use that rises while the cache loads, sometimes after the pod is Ready. Decide whether the warming must finish before Ready. If yes, include its CPU and memory in the startup size. If no, move it after Ready and watch the CPU use.
Turning Findings into Sizing Decisions
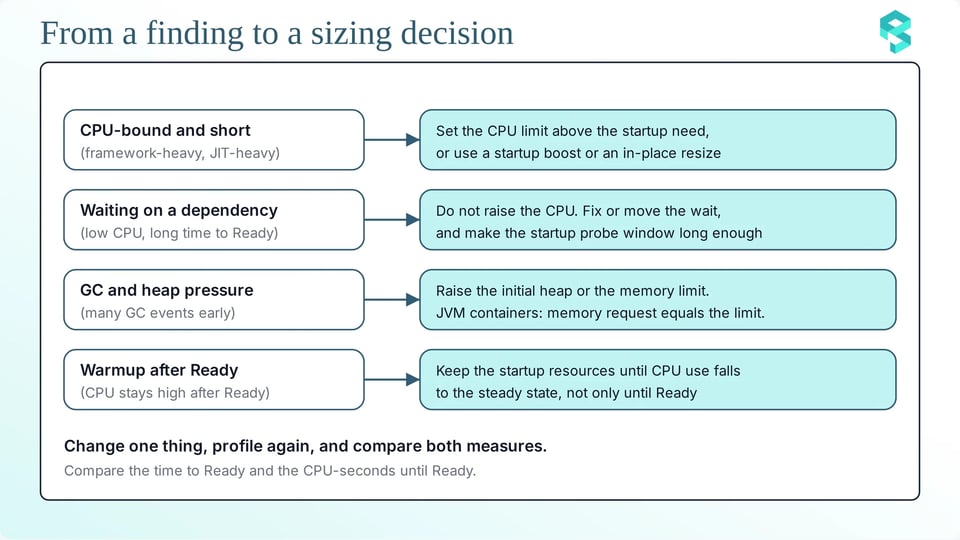
A finding becomes a sizing decision when you answer two questions. Is the work CPU-bound, or does it wait? Does the work stop after startup? These are the decisions:
a. CPU-bound and short (framework-heavy and JIT-heavy): Give startup enough CPU. Set the CPU limit above the startup need, or use a startup boost or an in-place resize, and keep the request near the steady state. If the limit is too low, the pod becomes Ready late, and the startup probe can fail.
b. Waiting on dependencies: Do not raise the CPU. Fix or move the wait, for example by running the migration as a separate job. Set the startup probe window, which is failureThreshold × periodSeconds, to at least the slowest time to Ready that you measured, plus a margin. In this example, the window is 24 × 5 = 120 seconds:
startupProbe: httpGet: path: /actuator/health/liveness port: 8080 periodSeconds: 5 failureThreshold: 24If the window is too short, the kubelet restarts the container, and the new container repeats the same wait.
c. GC and heap pressure: Raise the initial heap or the memory limit. For JVM containers, keep the memory request equal to the memory limit. Do not lower the memory limit after startup, because the JVM sets its maximum heap at startup.
d. Warmup after Ready: Keep the startup resources until the CPU use falls to the steady state.
e. Check after each change: Change one thing, profile again, and compare the time to Ready and the CPU-seconds until Ready. A change helps only if both measures improve.
Profiling Startup Across Many Services
You can profile one service by hand, but you cannot profile every service by hand. Use cluster metrics to find the services that cost the most to start, and profile only those. Three steps will help you:
a. Rank pods by time to Ready: This query uses two metrics from kube-state-metrics. Replace app with the name of your container:
topk(20, max by (namespace, pod) ( kube_pod_status_ready_time - on (namespace, pod, uid) kube_pod_container_state_started{container="app"} ))The query returns only pods that still have metrics. Pods that Kubernetes removed long ago do not appear.
b. Rank containers by CPU in the first 10 minutes: The CPU counter starts at zero when a container starts, so its value after 10 minutes is the CPU-seconds of the first 10 minutes:
topk(20, max by (namespace, container) ( max_over_time( ( container_cpu_usage_seconds_total{container!~"POD|"} and on (namespace, pod) (time() - kube_pod_start_time < 600) )[7d:1m] ) ))Change 600 to the startup time of your service. Run this query when the pods are older than 10 minutes, because younger pods show only part of their CPU. The result is the highest value among the pods of each container, so the query ranks containers and not single pods.
c. Profile the top services: Take the services that rank high in both queries. Capture a startup profile for each one under its production limits, and assign each service to one of the five categories.
PerfectScale shows key JVM metrics across your clusters. For Java containers, it collects heap and non-heap memory usage, along with garbage collection (GC) metrics, including GC time, active processor count, and GC type. JVM metrics collection can be enabled during PerfectScale agent installation, with no additional setup required. This feature is supported on Linux nodes only.
Once JVM data collection is enabled, PerfectScale gives you granular visibility into application behavior, helping you identify services with high startup resource requirements. PerfectScale automatically detects these services and provides two recommendations for each workload: one for startup and one for steady-state runtime.
PerfectScale applies the startup recommendation when a pod is created, then adjusts resources in place to match the runtime recommendation once the pod reaches a steady state, helping you optimize resource allocation for both phases without compromising application performance. PerfectScale also respects your JVM heap size limits, so recommendations never exceed your configured maximum heap size or fall below your configured minimum. And no pod restart or manual intervention is needed.
In-place resize needs Kubernetes 1.33 or later, and the container resize policy restartPolicy: NotRequired. It supports Deployments, StatefulSets, DaemonSets, and Argo Rollouts, and it does not support Windows pods.
Getting Java pod sizing right is key to balancing application performance and resource efficiency. This guide covers the must-do basics, but if you want to see a more advanced approach in action, join Vikram Seshadri from DoiT in the hands-on workshop “Java on K8s: The Startup vs. Steady-State Sizing Dilemma” on October 28, 2026 at 11 AM ET. He shows how to size a JVM pod for its startup, and how to resize it to steady state without a restart. Save your seat.
Do you want to see how PerfectScale right-sizes your Java workloads? Start for free or book a technical session.