Subscribe to our newsletter
Thank you! Your submission has been received!
Oops! Something went wrong while submitting the form.

Kubernetes gives us flexibility and power. With flexibility comes complexity. Knowing exactly when to use each component can be tricky, and engineers often make mistakes that you just can’t ignore. The good news? They’re all avoidable.
In this article, we’ll walk through six common pitfalls and show you how to avoid them.
Let’s dive in!
One of the most common and costly mistakes in Kubernetes is misconfiguring or skipping CPU and memory requests and limits. If you don’t set these values, Kubernetes may overschedule pods on nodes, leading to “noisy neighbor” problems, where one workload hogs resources, slowing others down. On the other hand - under‑provisioning resources leads to frequent crashes (OOMKilled) or heavy CPU throttling, slowing your services down or causing instability. Conversely, over‑allocating “just in case” drives wasted spend, idling pricey vCPUs and RAM without delivering value.
Avoid this by first measuring actual usage, not guessing. Tools like Metrics Server or Prometheus give you real data to set sensible values. e.g., a values block might be:
For latency‑sensitive apps, you should skip CPU limits to avoid throttling. Evaulate enabling Horizontal and Vertical Pod Autoscalers (HPA/VPA) so Kubernetes can automatically adjust pod counts and resource allocations in response to real demand. And regularly audit your settings, because workloads and their resource demands evolve.
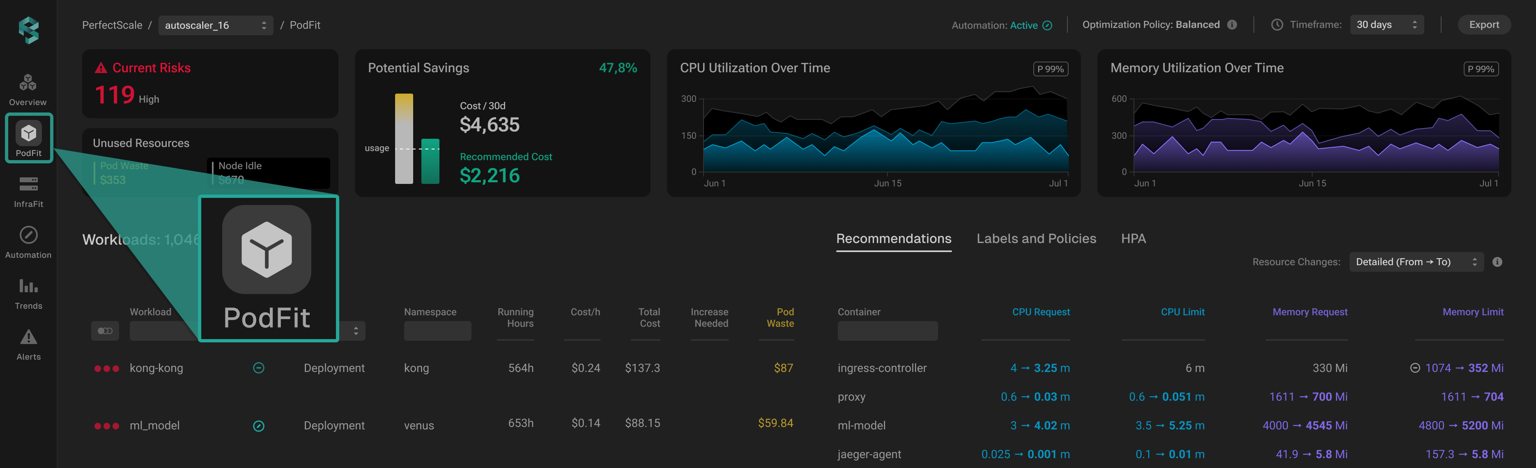
PerfectScale makes optimizing resource usage straightforward and reliable. Its ps-agent continuously monitors actual CPU and memory consumption, feeding data into the psc-autoscaler, which then generates precise right-sizing recommendations. These aren’t vague suggestions. PerfectScale supports applying them automatically through its automation agent, which can update workloads safely without manual intervention.
The system can reduce idle capacity and cloud costs by up to 50%, while also preventing crashes and CPU throttling.
The automation components run with secure RBAC permissions and integrate seamlessly with GitOps pipelines. If you prefer to review changes before applying them, PerfectScale offers full visibility via Infrafit and Podfit dashboards, so you see exactly what is changing, why, and when before costs or performance are impacted.
›› Try PerfectScale’s PodFit now to see exactly where your workloads are over- or under-provisioned and apply right-sizing automatically.
Too many clusters or node pools, especially ones reserved for specific hardware like GPU or ARM, can introduce unnecessary complexity and cost. Teams spin up separate clusters per team or purpose, only to leave resources underused. This breaks centralized tooling, complicates updates, and makes autoscaling nearly impossible to manage efficiently. Having many small clusters and node pools often results in inefficient scaling and fragmented operations. When the environment is fragmented like this, nodes are frequently only partially utilized, so resources go unused, and your spending increases.
To avoid this, consolidate into mid-sized, multi-purpose clusters that serve several workloads. Keep the number of node pools minimal, typically one for system pods and one for application pods, to simplify autoscaling and limit idle nodes. You should adopt a GitOps-driven CI/CD pipeline so your YAML is automatically validated, deployed, and tracked across environments. This approach boosts resilience, simplifies updates, and reduces engineering overhead. You should combine well-sized node types, both small and large, into a unified node strategy that helps Kubernetes schedule appropriately, preventing resources from sitting idle. In order to benefit from dynamic node type choice appropriate for the specific workloads, look into implementing smart node autoscaling with Karpenter or NAP.
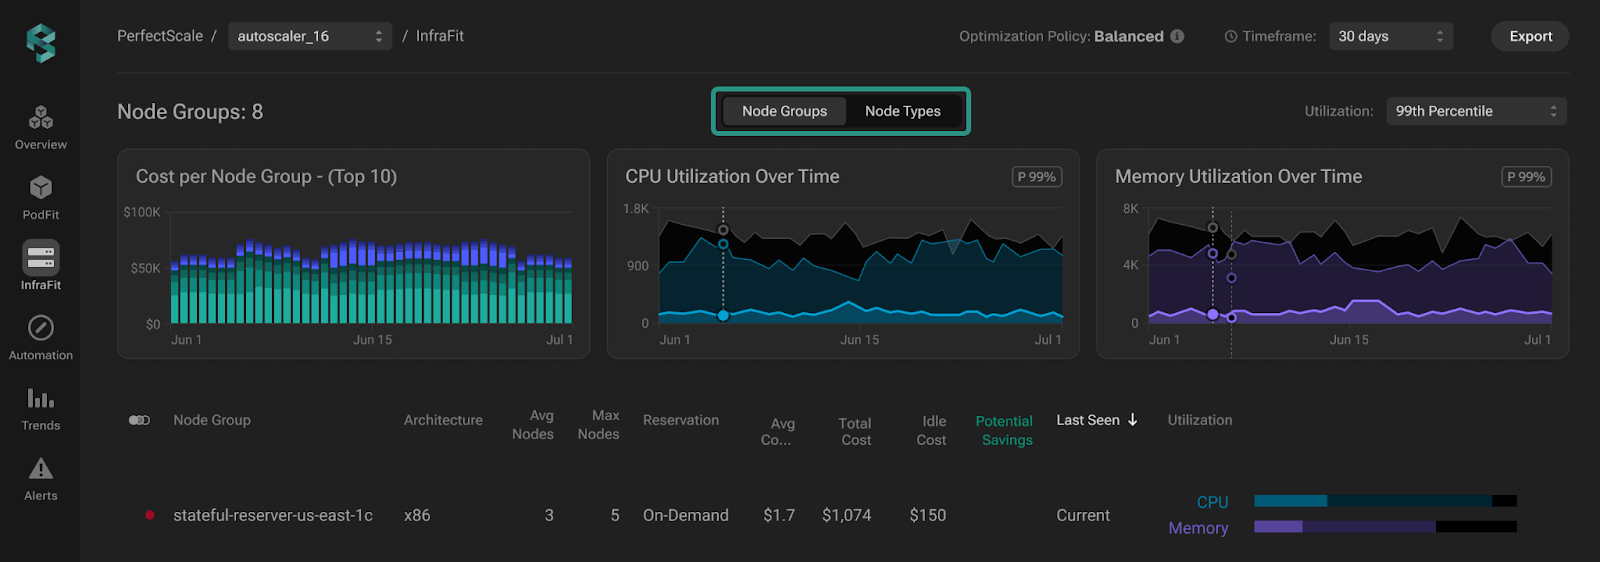
PerfectScale improves node management by analyzing your clusters with its InfraFit engine.
InfraFit gives you an unparalleled, detailed, historical view of node utilization across your Kubernetes clusters.
This uses real usage data to identify idle capacity, over‑ or undersized nodes, and even which instance types perform best for your workloads. It then generates node recommendations, for example, switching from one instance type to another, with cost impact estimates.
You can review these suggestions in the PerfectScale UI and apply them manually, or let your autoscaler (like Karpenter or Cluster Autoscaler) act on them automatically, depending on your setup. PerfectScale’s guidance takes the guesswork out of node management, saving cost and boosting performance.
›› Try PerfectScale’s InfraFit today to identify idle nodes, over-sized instances, and the best node types for your workloads and start cutting node costs immediately.
Skipping health checks, running only a single replica, using outdated container images, or relying on the “latest” tag are all ways to introduce fragility in production environments. Without liveness probes, your app won’t restart if it gets stuck, and without readiness probes, Kubernetes may route traffic to pods that aren't ready or healthy. Misconfigured probes (too frequent, too aggressive) can even trigger cascading crashes under load. One replica leaves you vulnerable to downtime during updates or node failures, while using: latest makes deployments unpredictable and rollback nearly impossible.
To fix this, enforce startup, liveness, and readiness probes tailored to your application's behavior, setting initial delays, timeouts, and thresholds correctly. Always deploy at least two replicas for critical services and use rolling updates tied to pinned image versions so you control when and what is deployed. This minimizes downtime, ensures health, and protects against image drift.
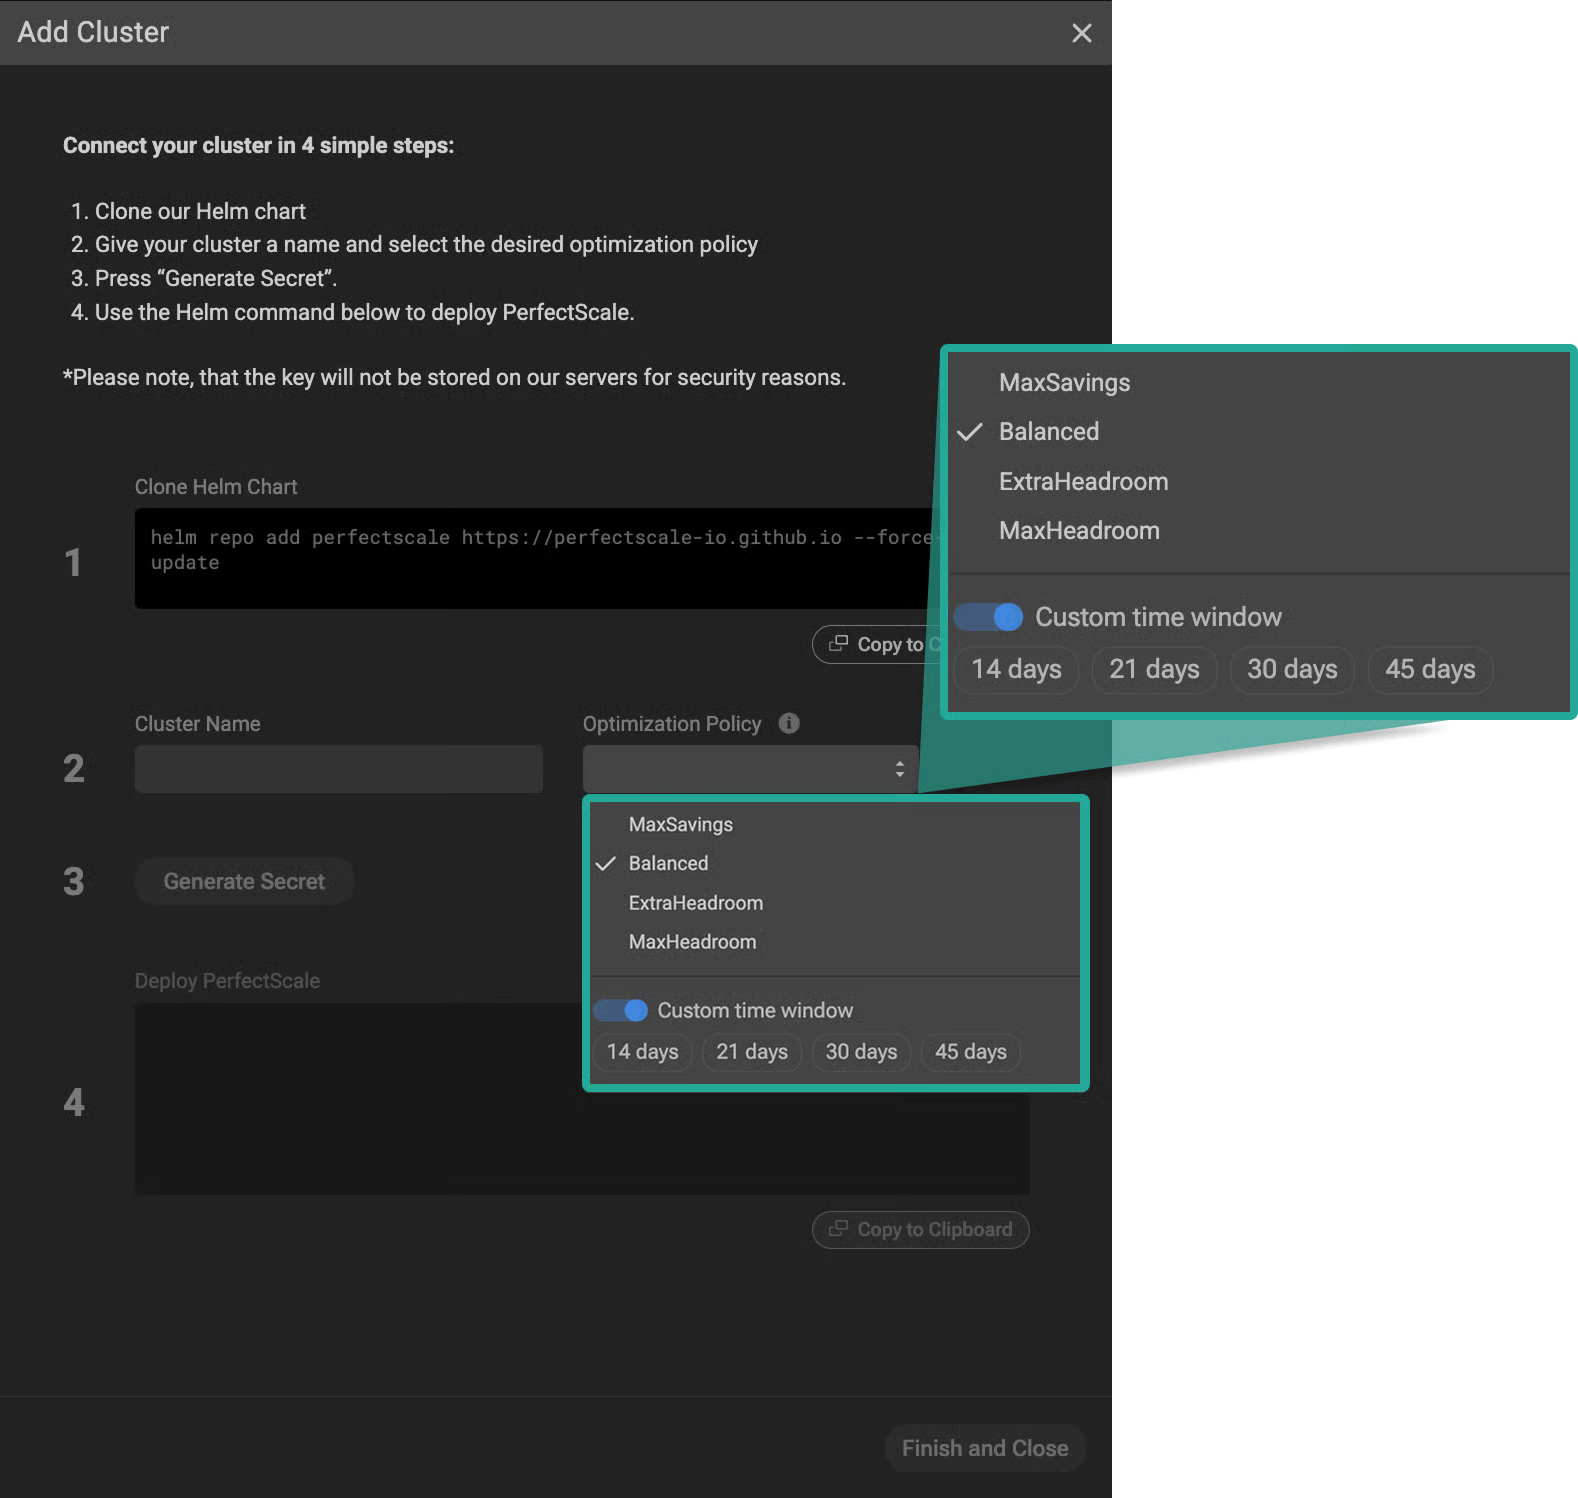
PerfectScale lets you set Optimization Policies at both cluster and workload levels through its dashboard - options include MaxSavings, Balanced, ExtraHeadroom, and MaxHeadroom. These policies guide how aggressively to optimize for cost versus reliability.
With automation enabled, PerfectScale uses these policies to maintain availability and resilience, applying your chosen settings safely while respecting health targets and SLAs.
›› Explore PerfectScale’s Optimization Policies now and automatically balance cost savings with rock-solid reliability.
A major pain in many Kubernetes environments is siloed logs and metrics, with logs in one place, metrics in another, and no centralized dashboard to tie them together. This fragmented setup makes troubleshooting a headache: when something breaks, your response time slows while you chase down data across multiple tools or rely on manual CLI commands. Kubernetes built-in logging is very limited, so teams end up operating blind, or worse, using misconfigurations or unscalable manual processes, and the lack of visibility can make diagnosing correlated failures across pods and nodes nearly impossible and delay reaction times significantly.
To fix this, start by implementing a central monitoring and observability stack: use Prometheus (or managed offerings) for metrics, Fluentd/ELK or Loki for logs, and Thanos for scalable retention. Combine them with alerting systems and dashboards (Grafana, Kibana) so you’re notified ASAP of anomalies like memory spikes or error surges before major outages hit. Take it further with GitOps-driven CI/CD pipelines that not only deploy your services but also define and manage your observability configurations too. When alerts are tied to deployment contexts, you know exactly which pod version or commit caused latency or failures.
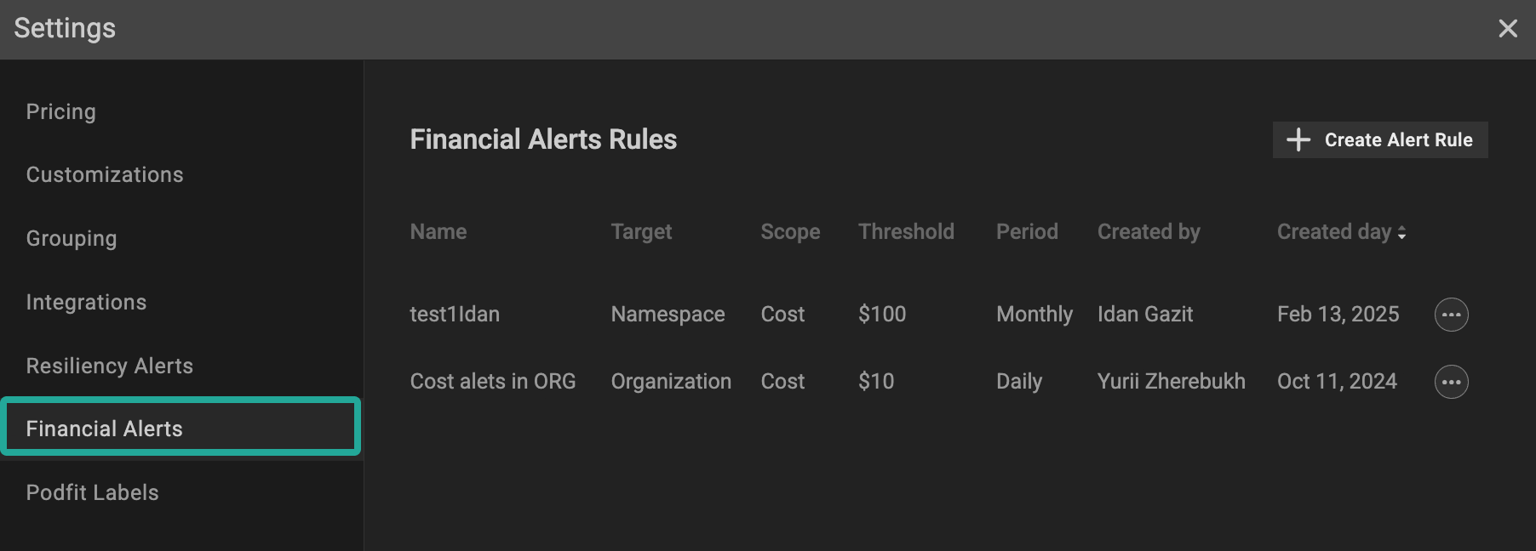
PerfectScale provides real-time vigilance by combining both resilience and financial alerting capabilities.
You can set up Slack or Microsoft Teams channels to receive instant notifications on anomalies, whether related to cost spikes, idle waste, or resilience risks, as soon as they occur in your clusters. The platform supports customizable resilience alerts (e.g., high-risk misconfigurations or resource constraints) and financial alerts (e.g. cost/waste threshold triggers), all visible through the PerfectScale UI. Integration with your existing observability stack ensures you gain full context, turning noisy data into actionable insights and shifting from reactive firefighting to proactive reliability.
›› Try PerfectScale’s real-time resilience and cost alerts to detect and resolve risks before they impact performance or budget.
A weak security setup in Kubernetes isn’t just dangerous, it can be expensive too. Common mistakes include overly permissive RBAC (especially using wildcard permissions), running containers as root, enabling hostNetwork or hostPort without necessity, and neglecting network policies. These misconfigurations not only make your cluster an easy target for attacks, but they can also lead to hidden costs like data exfiltration or incident remediation. Likewise, failing to scan images before deployment, new vulnerabilities can be discovered afterwards.
To protect your platform, enforce least-privilege RBAC - grant only the roles needed, with no wildcards and never assign cluster-admin unless absolutely necessary. Lock down pod security by disabling root containers, steer clear of hostNetwork/hostPort, and deploy default-deny NetworkPolicies to confine pod-to-pod traffic. Enforce image scanning so that vulnerabilities are caught before deployment. Governance tools like OPA or Kyverno can automate many of these checks and prevent misconfigurations from ever reaching production.
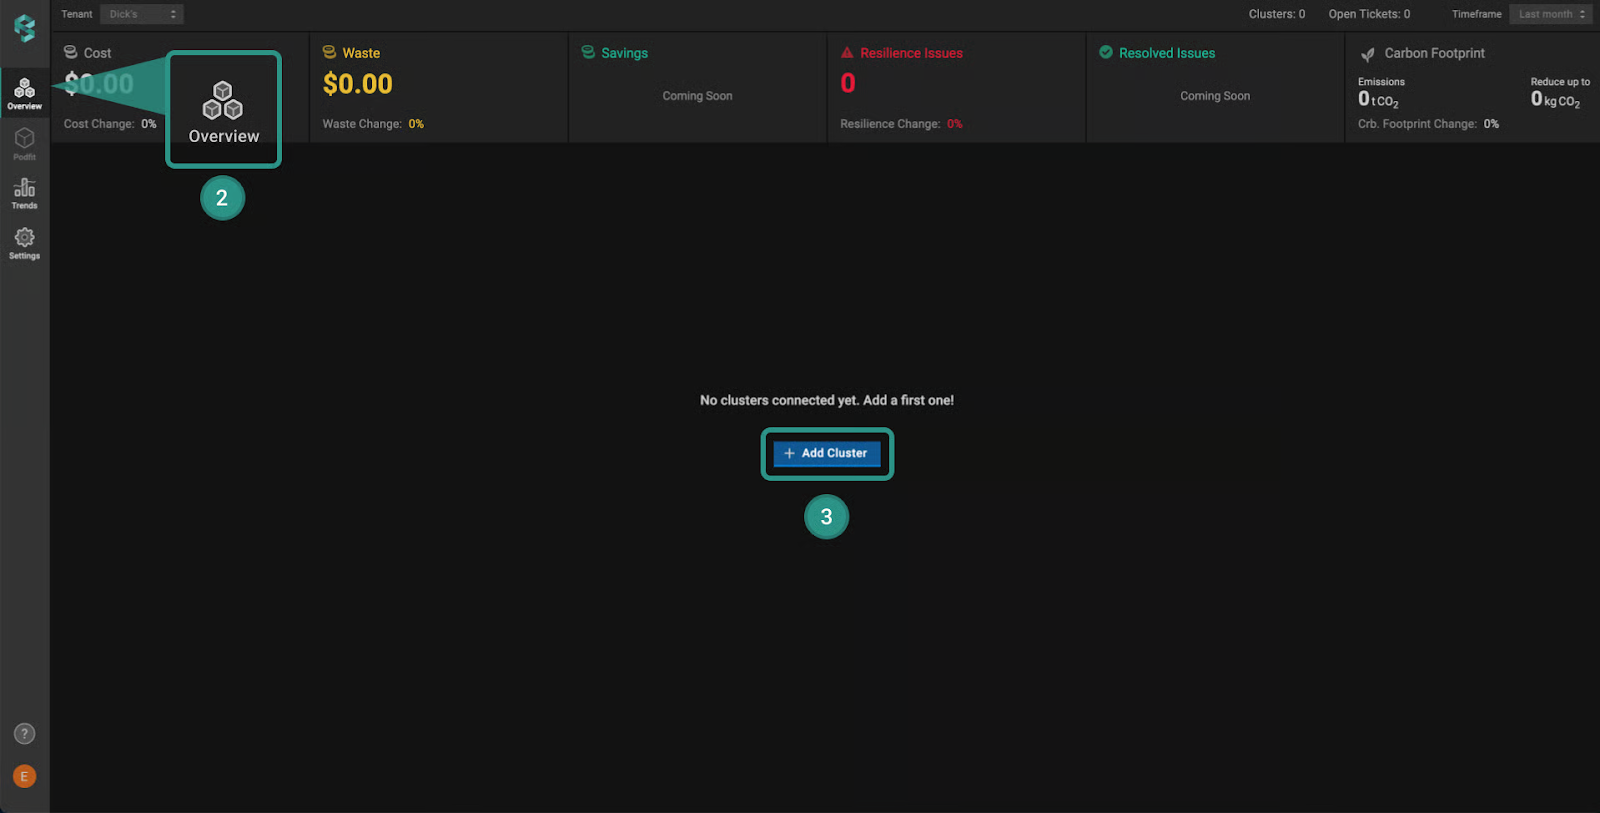
PerfectScale supports secure onboarding from the start by installing its agent with scoped access, using a service account with just the necessary RBAC permissions for monitoring pod, node, and namespace information. These features help you maintain a secure, compliant, and cost-efficient Kubernetes environment.
›› Onboard your cluster to PerfectScale today with secure, scoped RBAC access and start monitoring for cost and resilience optimizations immediately.
When cost management and autoscaling are handled in isolation, Kubernetes can quickly turn into a money pit. Manual cost reviews are error-prone, and reactive or misconfigured autoscaling leads to performance bottlenecks or unnecessary spending. Teams might spin up resources to meet demand, only later to leave them idle, often paying for 30–50% underutilized workloads without realizing it. Worse still, autoscalers that aren’t tuned can create wild fluctuations, pods crash for lack of resources during demand spikes, or nodes remain idle during lulls all without anyone noticing until the bill arrives.

To solve this, you need a unified, cost-aware autoscaling strategy. Combine real-time cost dashboards with intelligent resource rightsizing, and automate scaling using the tools of your choice tuned to your usage patterns. That means setting up smart scaling thresholds. Integrating cluster autoscaling prevents orphaned or underutilized nodes from accumulating cost, and continuous rightsizing ensures you’re not over-reserving resources in the first place.
PerfectScale brings this all together with a cost-aware orchestration engine. It overlays financial data on your cluster metrics in real time, recommending rightsizing actions that balance cost and reliability.
Whether you prefer manual reviews or direct automation, PerfectScale’s smart autoscaler can adjust pod counts and node pools dynamically, delivering up to 50% cost savings without sacrificing performance.
This coordinated approach ensures no more silos: your costs, workloads, and scaling policies work together smoothly to keep your Kubernetes environment efficient, stable, and budget-friendly.
›› Try PerfectScale’s cost-aware autoscaler now and automatically balance performance with up to 50% lower Kubernetes costs.


Install in minutes and instantly receive actionable intelligence.


.png)


.png)