


The KEDA Helm chart is the official way to install KEDA, the Kubernetes Event-Driven Autoscaler, in your cluster. One helm install deploys everything KEDA needs to scale your workloads on events: the operator, the metrics server, the admission webhooks, and the custom resources you use to define scaling rules.
This guide covers the chart in depth. You'll learn what it deploys, how to install and verify it, the key values.yaml parameters, how to run KEDA in high availability, how to harden and monitor it, how to manage it through GitOps, and how to upgrade or uninstall it without leaving broken resources behind.
What is the KEDA Helm chart?
KEDA scales your pods based on events, such as the length of a queue, the lag on a Kafka topic, the number of HTTP requests, or a cron schedule. The built-in Horizontal Pod Autoscaler (HPA) can only scale on CPU and memory. KEDA adds all those event sources on top, and it can also scale a workload down to zero pods when there is nothing to do.
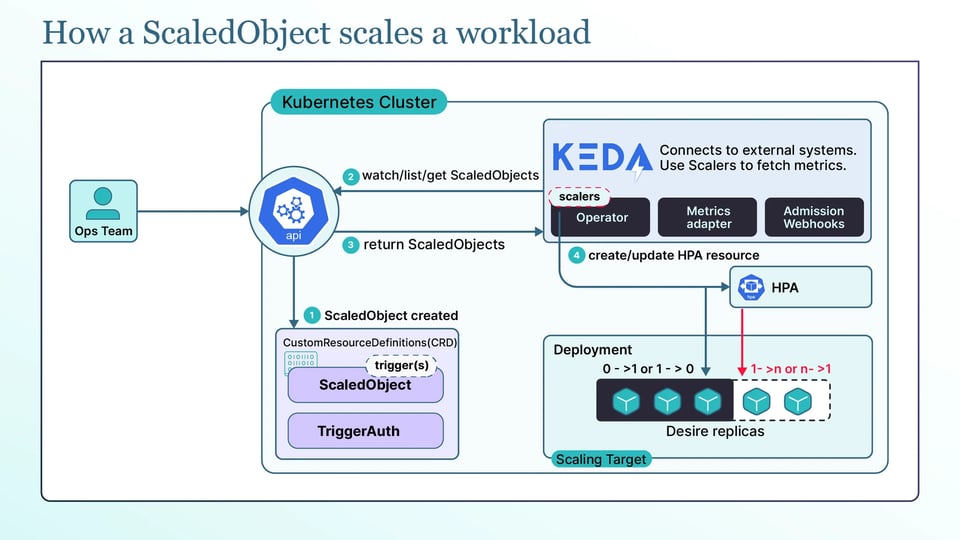
KEDA does not replace the HPA. It reads your event source and creates an HPA that does the actual scaling, feeding it external metrics. You describe what to scale in a custom resource called a ScaledObject.
The Helm chart installs KEDA and its supporting components in one step, which is why it is the recommended way to deploy it.
What the chart deploys into your cluster?
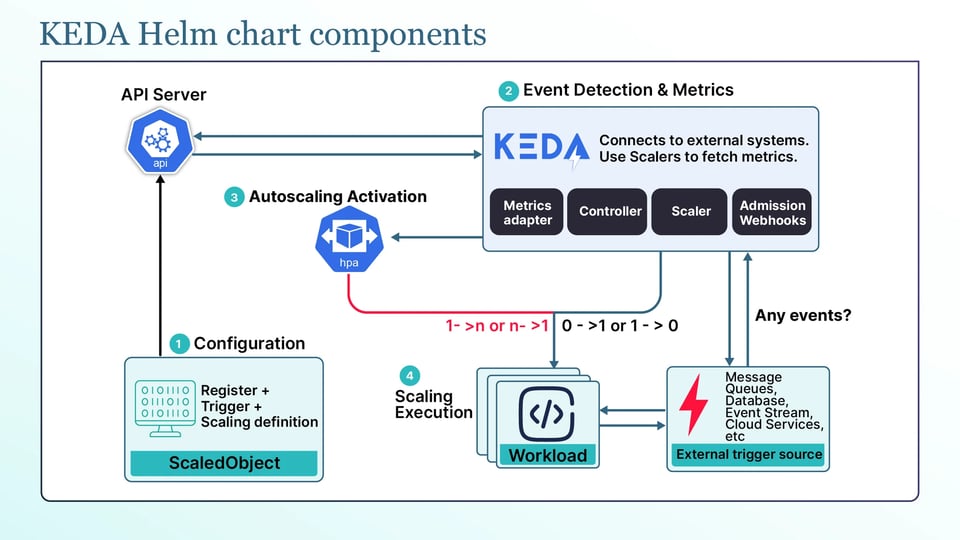
When you install the KEDA Helm chart in your cluster, it installs the following components:
a. KEDA operator: The main controller in KEDA. It watches your ScaledObject and ScaledJob resources and manages the HPA that handles scaling. It is the core part of KEDA.
b. Metrics API server: Makes your event-based metrics available to Kubernetes through the external.metrics.k8s.io API. This allows the HPA to scale based on things like queue length instead of only CPU or memory.
c. Admission webhooks: It validate your KEDA resources when you create them. They catch configuration mistakes early, such as two ScaledObject resources trying to scale the same workload.
Finally, the chart installs the CRDs, which add the KEDA resource types you work with: ScaledObject, ScaledJob, TriggerAuthentication, and ClusterTriggerAuthentication. It also installs the RBAC permissions these components need.
Prerequisites and version compatibility
Before installing KEDA, check the following prerequisites and version requirements:
a. KEDA 2.20 requires Kubernetes 1.30 or newer, so first check your cluster version with kubectl version. You also need Helm 3, because the KEDA chart only supports Helm 3.
b. Make sure your cluster has enough available resources to run KEDA's components. The chart also pulls container images from ghcr.io, so your nodes need network access to the image registry.
c. The KEDA metrics server also creates a cluster-wide APIService, so any network policies in the keda namespace must allow the traffic KEDA needs. If your cluster is locked down or air-gapped, make sure the required network access and images are available before installing.
Installing the KEDA Helm chart
First, add the official KEDA repository and update it:
helm repo add kedacore https://kedacore.github.io/chartshelm repo updateInstall into a dedicated namespace, and pin the chart version rather than taking whatever is latest:
helm install keda kedacore/keda \ --namespace keda \ --create-namespace \ --version <chart-version>Pinning the version matters because the chart version maps to a specific KEDA app version, and you want the version you tested. You can see available versions with helm search repo kedacore/keda --versions.
After installing, verify the three parts that have to be healthy. Check that the pods are running:
kubectl get pods -n kedaThen confirm the CRDs are present and the external metrics APIService is registered and available:
kubectl get crd | grep keda.shkubectl get apiservice v1beta1.external.metrics.k8s.ioIf the pods are running and that APIService shows True for Available, KEDA is installed correctly.
Other ways to deploy KEDA
The Helm chart is the recommended way to install KEDA, but it is not the only option. The right choice depends on how you manage your cluster. The following are the other ways:
a. OpenShift: You can install KEDA through OperatorHub and the Operator Lifecycle Manager (OLM). OLM manages the KEDA operator and its upgrades instead of Helm.
b. Raw YAML manifests: If you cannot use Helm, KEDA provides YAML manifests for each release that you can apply with kubectl apply. With this approach, you manage CRDs and upgrades yourself.
c. MicroK8s: KEDA is available as a built-in add-on that you can enable with a single command.
Whichever method you choose, the main KEDA components and CRDs are the same. The main difference is how KEDA is packaged and managed.
Key parameters in values.yaml
The following are the key parameters to know in values.yaml:
a. Image registries, repositories, and tags: Each KEDA component (image.keda, image.metricsApiServer, and image.webhooks) has its own registry, repository, and tag. If you leave the tag empty, the chart uses the KEDA app version. In restricted environments, you can set these values to use your own image registry or mirror.
b. crds.install and CRD ownership: By default, the chart installs and manages the CRDs. If another tool, such as a GitOps tool, already manages them, set crds.install: false so both systems do not try to manage the same CRDs.
c. watchNamespace and namespace scope: By default, KEDA watches all namespaces. Setting watchNamespace limits KEDA to a specific namespace. This can be useful in a shared cluster when you want to limit where KEDA operates.
d. Resource requests and limits: You can set resources separately for the operator, metrics server, and webhooks using resources.operator, resources.metricServer, and resources.webhooks. Set appropriate requests and limits so KEDA has enough resources to run reliably, even when the cluster is under pressure.
Configuring KEDA for high availability
In production, you do not want KEDA to stop working if a node goes down. You run its components with multiple replicas and spread them across different nodes.
The operator supports multiple replicas through operator.replicaCount. It uses leader election, so only one operator instance is active at a time while the others are ready to take over if needed.
The metrics API server can also run multiple replicas through metricsServer.replicaCount. This helps keep external metrics available if one replica fails.
You should also use pod anti-affinity to spread replicas across different nodes and a PodDisruptionBudget (PDB) to make sure a node drain does not take down all replicas at once.
A production values.yaml can look like this:
operator: replicaCount: 2metricsServer: replicaCount: 2podDisruptionBudget: operator: minAvailable: 1 metricServer: minAvailable: 1affinity: podAntiAffinity: preferredDuringSchedulingIgnoredDuringExecution: - weight: 100 podAffinityTerm: topologyKey: kubernetes.io/hostname labelSelector: matchLabels: app: keda-operatorTuning scaler HTTP and TLS settings
Many KEDA scalers connect to external systems over HTTP. In a locked-down environment, you may need to control how these connections work. KEDA provides settings for configuring HTTP, TLS, and proxy connections:
a. HTTP timeout: KEDA_HTTP_DEFAULT_TIMEOUT sets the default timeout for scalers that use KEDA's built-in HTTP client. The value is in milliseconds. Some scalers use their own vendor SDKs, so this setting does not apply to those scalers.
b. Minimum TLS version: KEDA_HTTP_MIN_TLS_VERSION sets the minimum TLS version for KEDA's outbound HTTP connections. KEDA_SERVICE_MIN_TLS_VERSION sets the minimum TLS version for KEDA's own TLS services, such as the webhook and gRPC services. The default is TLS 1.3.
c. TLS cipher list: KEDA_HTTP_TLS_CIPHER_LIST lets you restrict which TLS ciphers KEDA can use. However, this setting does not affect TLS 1.3, because the Go TLS library does not allow those ciphers to be configured for TLS 1.3.
d. HTTP and HTTPS proxy: If KEDA needs to connect to external systems through a corporate proxy, configure the standard HTTP_PROXY, HTTPS_PROXY, and NO_PROXY environment variables on the KEDA operator.
Hardening the installation
There are two settings that can improve KEDA's security in production: limiting secret access and managing certificates. Let's discuss:
a. Limit secret access: By default, KEDA can read secrets across the namespaces it watches. The permissions.operator settings let you restrict this access so the operator can read secrets only in its own release namespace or only specific named secrets. This reduces what a compromised operator could access.
b. Manage certificates: KEDA generates its own self-signed certificates, stores them in a secret named kedaorg-certs, and mounts them into its components. KEDA also rotates these certificates automatically and updates the required Kubernetes resources so they are trusted.
c. If your organization requires certificates from a managed certificate authority, enable certificates.certManager.enabled so cert-manager can issue and rotate the certificates instead of KEDA. For most installations, the auto-generated certificates are sufficient.
Deploying the chart through GitOps
If you manage your cluster with Argo CD or Flux, you can deploy the KEDA chart through GitOps. The main thing to handle carefully is the CRDs.
KEDA's CRDs are large, and a normal Kubernetes apply can fail because the generated annotation becomes too large. To avoid this, configure your GitOps tool to replace the CRDs instead of merging them. In Flux: Set crds: CreateReplace in the HelmRelease and in Argo CD: Use Replace=true or server-side apply for the CRDs so they are applied correctly.
If the CRDs are not configured correctly, the GitOps-managed KEDA installation can fail.
You can also use helm template to render the chart into regular Kubernetes YAML files and commit those files to Git if your workflow prefers managing rendered manifests instead of a live Helm release.
Whichever approach you use, keep the app.kubernetes.io/managed-by label consistent so your GitOps tool and Helm do not conflict over resource ownership.
Creating your first ScaledObject after installation
With KEDA installed, a ScaledObject lets you verify that KEDA can actually scale a workload. The example below uses a cron trigger, so it does not need an external system. It scales a Deployment up during a scheduled time and back down when the schedule ends.
First, create a Deployment to scale, then apply the ScaledObject:
apiVersion: keda.sh/v1alpha1kind: ScaledObjectmetadata: name: nginx-cron namespace: defaultspec: scaleTargetRef: name: nginx pollingInterval: 30 cooldownPeriod: 300 minReplicaCount: 0 maxReplicaCount: 5 triggers: - type: cron metadata: timezone: Asia/Kolkata start: 0 9 * * * end: 0 17 * * * desiredReplicas: "5"pollingInterval tells KEDA how often, in seconds, to check the trigger. minReplicaCount: 0 enables scale-to-zero. Outside the 9-to-5 window, the Deployment can scale down to zero pods. During the scheduled window, it scales up to five replicas.
Apply the ScaledObject and check what KEDA created:
kubectl get scaledobjectkubectl get hpaYou should see an HPA named keda-hpa-nginx-cron. KEDA creates and manages this HPA to handle the actual scaling. This confirms that KEDA is connected to the workload and that the scheduled scaling configuration is working.
Monitoring the KEDA installation
Once KEDA is running, you should check that it is healthy and working as expected.
KEDA provides Prometheus metrics for both the operator and the metrics server. These metrics show scaler activity, errors, and the values KEDA reports.
If you use the Prometheus Operator, the KEDA chart can create a ServiceMonitor for the metrics server and a PodMonitor for the operator. You can enable these through the prometheus settings in values.yaml, so Prometheus can collect the metrics automatically.
The operator logs are also useful when a specific ScaledObject is not working as expected. They show how the scaler is reading its trigger and any errors it encounters.
You can view the operator logs with:
kubectl logs -n keda deploy/keda-operatorRight-sizing the workloads KEDA scales
KEDA is good at scaling the number of pods based on demand. But it does not decide how much CPU and memory each pod should request.
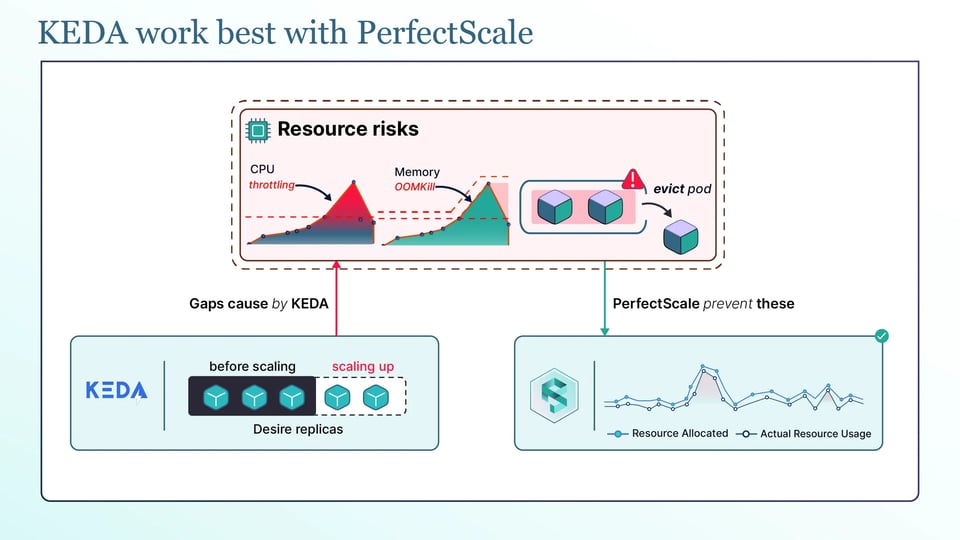
Adding more replicas does not fix incorrect resource requests. If each pod requests much more CPU or memory than it actually uses, KEDA can multiply that waste as it adds more replicas. If each pod requests too little, the new replicas may get OOMKilled or CPU throttled when traffic increases.
This is where resource optimization tools can help. PerfectScale monitors how workloads actually use CPU and memory and provides automated right-sizing recommendations that you can apply manually or automatically.
Paired with KEDA, you get both sides of autoscaling: KEDA adjusts the number of pods to match demand, while PerfectScale helps make sure each pod has the right amount of CPU and memory. This can help prevent over-provisioning while keeping workloads reliable. You can give it a try or book a technical session.
Other tools like Vertical Pod Autoscaler (VPA), which can adjust resource requests based on usage, Goldilocks, which helps visualize VPA recommendations, and Karpenter focus on choosing and managing the nodes that run your workloads.
Upgrading and uninstalling the chart
There are a few important things to check when upgrading or uninstalling KEDA.
To upgrade KEDA, first refresh the Helm repository and then upgrade to a pinned chart version:
helm repo updatehelm upgrade keda kedacore/keda --namespace keda --version <new-chart-version>The thing to watch during an upgrade is the CRDs. Because the chart manages them, a helm upgrade updates them along with everything else, but KEDA minor versions occasionally change CRD fields or scaler behavior, so read the release notes before you upgrade a production cluster, and check that the new KEDA version still supports your Kubernetes version.
Uninstalling KEDA also needs some care because removing it can leave resources behind.
First, delete the ScaledObject and ScaledJob resources:
kubectl delete scaledobject --all --all-namespaceskubectl delete scaledjob --all --all-namespacesThen uninstall the Helm release:
helm uninstall keda --namespace kedaWhen deleting the ScaledObject and ScaledJob resources first, it allows KEDA to clean up the HPAs it created. It also gives workloads that were scaled to zero a chance to return to their normal replica count before KEDA is removed.
If a resource gets stuck while being deleted because of a finalizer, you can remove the finalizer with:
kubectl patch scaledobject <name> -p '{"metadata":{"finalizers":null}}' --type=mergeTroubleshooting common chart problems
There are two common problems to look for when KEDA is not scaling as expected:
a. External metrics API is unavailable or failing TLS verification: If kubectl get apiservice v1beta1.external.metrics.k8s.io does not show Available, the HPA cannot get external metrics, so workloads cannot scale based on them. The common causes include an unhealthy metrics server, a NetworkPolicy blocking traffic, or a proxy interfering with the connection between the Kubernetes API server and the metrics server. Check the metrics server pod first. If you use a proxy, make sure the metrics server's cluster IP is included in the API server's no_proxy list.
b. A ScaledObject is created but replicas do not change: Start with kubectl describe scaledobject <name> and check its status and events. Then check the KEDA operator logs. The causes can be a misconfigured trigger, missing authentication for the event source, or an existing HPA already targeting the same workload. The existing HPA can conflict with the HPA that KEDA creates and manages.
Best practices for running the KEDA Helm chart
The following practices can help keep a KEDA installation stable and secure:
a. Pin the chart version and match it to a tested KEDA app version: Do not install or upgrade to whatever is latest. Pin the chart, test that KEDA version, and roll it out carefully so you always know what is running.
b. Keep KEDA in its own namespace with its own resource quota: A dedicated namespace keeps KEDA isolated and makes it easier to apply a ResourceQuota and NetworkPolicy specifically to KEDA.
c. Set explicit requests and limits on all three KEDA components: you have to set appropriate resources for the operator, metrics server, and webhooks so KEDA itself is not throttled or evicted when the cluster is under pressure.
d. Use TriggerAuthentication instead of putting credentials directly in ScaledObject: You should keep credentials out of your ScaledObject manifests by referencing a TriggerAuthentication or ClusterTriggerAuthentication. This helps keep credentials out of version control and allows you to reuse them.
e. Avoid pairing a ScaledObject with a manually created HPA on the same workload: If there are two controllers trying to scale the same workload can conflict with each other. Let KEDA manage the HPA for workloads that KEDA scales.
f. Test upgrades in a non-production cluster before rolling them out: KEDA minor versions can include CRD changes, so test the upgrade in a safe environment first. This helps catch compatibility issues before they affect production workloads.