Table of Content
Subscribe to our newsletter
Thank you! Your submission has been received!
Oops! Something went wrong while submitting the form.
Kubernetes monitoring is how you keep visibility into what is happening across your clusters, nodes, pods, and applications. Without it, small problems become outages before anyone notices.
Here is what you need to know:
Monitoring alone is not enough. The data only helps if you act on it - which means combining good alerting rules, autoscaling integration, and continuous resource optimization.
Kubernetes (K8s) monitoring is the essential process of collecting metrics, logs, and events from clusters, nodes, and pods to ensure stability, performance, and resource optimization. It involves tracking CPU/memory usage, pod uptime, and application health, crucial for managing the dynamic and ephemeral nature of containerized environments.
Monitoring in Kubernetes goes beyond simply checking if services are running. It requires a systematic approach to gather telemetry from various layers of the stack. This data helps operators understand how workloads behave under different conditions, identify bottlenecks, and troubleshoot failures. Effective Kubernetes monitoring relies on automated tools and integrations that can handle the dynamic and distributed nature of containerized environments.
Common monitoring tools and frameworks used in Kubernetes environments include commercial solutions like PerfectScale, Dynatrace, and Datadog, and open source solutions like Kube-State-Metrics, Prometheus, and Grafana.
In this article:
Kubernetes monitoring is important because Kubernetes environments are highly dynamic and distributed. Containers can start, stop, or move between nodes in seconds, making manual oversight impractical. Without proper monitoring, small issues such as resource exhaustion or failed deployments can escalate into service outages.
Monitoring helps teams maintain cluster stability, improve application performance, and reduce downtime. It also provides the visibility needed to manage scaling, troubleshoot incidents, and optimize infrastructure costs.
Key reasons why Kubernetes monitoring is critical in modern DevOps environments:
Kubernetes monitoring and observability are related but distinct concepts. Monitoring focuses on collecting predefined sets of metrics and data to track the health and performance of the cluster. It answers questions like “Is the API server responding?” or “Is this deployment using too much memory?” Monitoring solutions rely on dashboards and alerts to notify operators of potential issues.
Observability is a broader discipline that focuses on understanding the internal state of a system based on external outputs. It includes metrics, logs, and traces and enables teams to ask new questions about system behavior. Observability tools support root cause analysis and debugging by providing contextual insights. Monitoring tells you when something is wrong; observability helps you understand why it happened.
Metrics are numerical data points that provide quantitative insights into the health and performance of Kubernetes resources. These can include CPU usage, memory consumption, network traffic, and request latency. Metrics are collected at regular intervals and stored in time-series databases, enabling trend analysis and historical comparisons. Tools like Prometheus are used to scrape and store metrics from Kubernetes components.
Metrics are used for setting up alerts, capacity planning, and identifying abnormal behaviors. They can be gathered from the cluster, nodes, pods, and applications. They provide a high-level overview of system health and can highlight areas that require deeper investigation.
Logs are textual records of events and messages generated by applications, containers, and Kubernetes components. They capture information about what is happening inside the system, including errors, warnings, and informational messages. Logs are important for troubleshooting because they provide context around failures or unexpected behavior. Centralized log aggregation solutions like Fluentd, Logstash, or Elasticsearch are often used to collect, store, and analyze logs from across the cluster.
Logs can become voluminous in large or active clusters, making log rotation, retention policies, and indexing strategies important. Log analysis allows operators to trace the sequence of events leading to an issue, correlate logs across services, and gain visibility into infrastructure and application-level operations.
Traces track the path of a single request or transaction as it flows through components of a distributed system. In Kubernetes, distributed tracing tools like Jaeger or OpenTelemetry are used to collect and visualize traces, which help identify latency bottlenecks and performance issues across microservices. Each trace includes spans that represent operations performed by different services, along with timing information.
Tracing is valuable in microservices architectures, where a single user request may traverse multiple pods and services. By following the journey of a request, operators can pinpoint where slowdowns or failures occur. This level of insight helps diagnose cross-service issues that are not apparent from metrics or logs alone.
Events in Kubernetes are records of significant changes or occurrences within the cluster, such as pod creations, deletions, restarts, or failures. These events are generated by the Kubernetes API server and can be accessed through the Kubernetes API or command-line tools like kubectl describe. Events provide a chronological record of changes and help explain how the cluster reached a particular state.
While events are not as granular as logs or metrics, they help correlate system changes with observed issues. For example, a spike in pod restarts can often be traced back to a specific event such as a failed deployment or resource constraint. Monitoring and analyzing events helps operators maintain situational awareness and respond to problems.
Kubernetes monitoring works by collecting telemetry data from the cluster, including nodes, pods, containers, control plane components, and applications. Monitoring tools use agents, exporters, and APIs to gather metrics, logs, traces, and events in real time. Components such as kubelet, cAdvisor, and kube-state-metrics expose operational data that monitoring platforms like Prometheus scrape and store. This data is centralized in databases or log management systems for analysis.
After collection, the monitoring platform visualizes the data through dashboards, charts, and reports. Operators can track resource usage, application performance, pod health, network activity, and cluster status from a single interface. Historical data helps teams identify trends, compare performance over time, and plan infrastructure capacity.
Monitoring systems support automated alerting and operational workflows. Alerts are triggered when predefined thresholds or abnormal conditions are detected, such as failed pods, high memory usage, or increased latency. Notifications can be sent through email, Slack, or incident management platforms. Monitoring data is also integrated with Kubernetes autoscaling mechanisms, allowing workloads to scale automatically based on demand and resource utilization.
Related content: Read our guide to Kubernetes alerting
Cluster-level metrics provide a high-level view of the health, stability, and resource utilization of the Kubernetes cluster. These metrics help operators understand whether the cluster has enough capacity to support workloads and whether core services are functioning correctly.
Key cluster-level metrics include:
Node-level metrics focus on the health and performance of worker nodes within the cluster. Since nodes provide the compute resources for workloads, monitoring them helps detect hardware failures, resource exhaustion, or operating system issues that may affect applications.
Key node-level metrics include:
Pod and container metrics provide visibility into the behavior and resource consumption of Kubernetes workloads. Since applications run inside containers, these metrics are important for troubleshooting crashes, performance bottlenecks, and inefficient resource usage.
Key pod and container metrics include:
Workload metrics measure the performance and operational status of Kubernetes objects such as deployments, daemonsets, statefulsets, and jobs. These metrics help teams verify that workloads are scaling correctly and meeting desired states.
Key workload metrics include:
Control-plane metrics track the health and responsiveness of Kubernetes core components responsible for cluster management and orchestration. Monitoring these components is important because control-plane failures can impact the cluster.
Key control-plane metrics include:
Application-level metrics focus on the performance and behavior of the applications running inside Kubernetes. These metrics help teams understand user experience, detect service degradation, and optimize application performance.
Key application-level metrics include:
Kubernetes environments generate large amounts of telemetry data from containers, nodes, applications, and control plane components. Metrics, logs, traces, and events can overwhelm monitoring systems, especially in large clusters running many workloads. Storing and processing this data requires compute, storage, and network resources.
High data volume also makes it difficult to identify meaningful insights. Important signals can become buried in noise, slowing troubleshooting and increasing operational complexity. Organizations often implement data retention policies, sampling, filtering, aggregation, and tiered storage strategies to reduce unnecessary telemetry while preserving critical information.
Poorly configured monitoring systems can generate excessive alerts, many of which may be low priority, repetitive, or irrelevant. In Kubernetes environments, transient events such as pod restarts, autoscaling actions, or temporary resource spikes can trigger many notifications. Over time, operations teams may begin ignoring alerts because distinguishing critical incidents from routine noise becomes difficult.
Alert fatigue reduces the effectiveness of monitoring and increases the risk of missing serious problems. To minimize this issue, teams need well-designed alerting rules, threshold tuning, alert grouping, and escalation policies. Some monitoring platforms use anomaly detection and alert correlation to reduce unnecessary notifications.
Kubernetes workloads are dynamic. Pods and containers can be created, terminated, rescheduled, or replaced within seconds. This ephemeral nature makes monitoring more difficult because telemetry sources change constantly, and short-lived workloads may disappear before data is fully collected or analyzed.
Traditional monitoring approaches designed for static infrastructure often struggle in these environments. Monitoring systems must automatically discover new workloads, update configurations dynamically, and maintain visibility as infrastructure changes. Persistent labeling, centralized telemetry collection, and Kubernetes-native integrations help ensure monitoring remains accurate.
PerfectScale by DoiT is an automated Kubernetes optimization and management platform that continuously right-sizes workloads, eliminates waste, and keeps clusters stable without manual effort. It analyzes resource usage across every workload and autonomously adjusts CPU and memory configurations to reduce cloud costs by up to 50% while maintaining 99.99% availability.
Key features include:
Start optimizing your Kubernetes costs with PerfectScale
Dynatrace is a commercial Kubernetes monitoring and optimization platform that provides observability, analytics, and security for Kubernetes environments and cloud-native applications. It supports Kubernetes distributions such as Amazon EKS, Azure AKS, Google GKE, Red Hat OpenShift, and Rancher Kubernetes Engine. The platform combines metrics, logs, traces, and security data into a single interface.
Key features include:
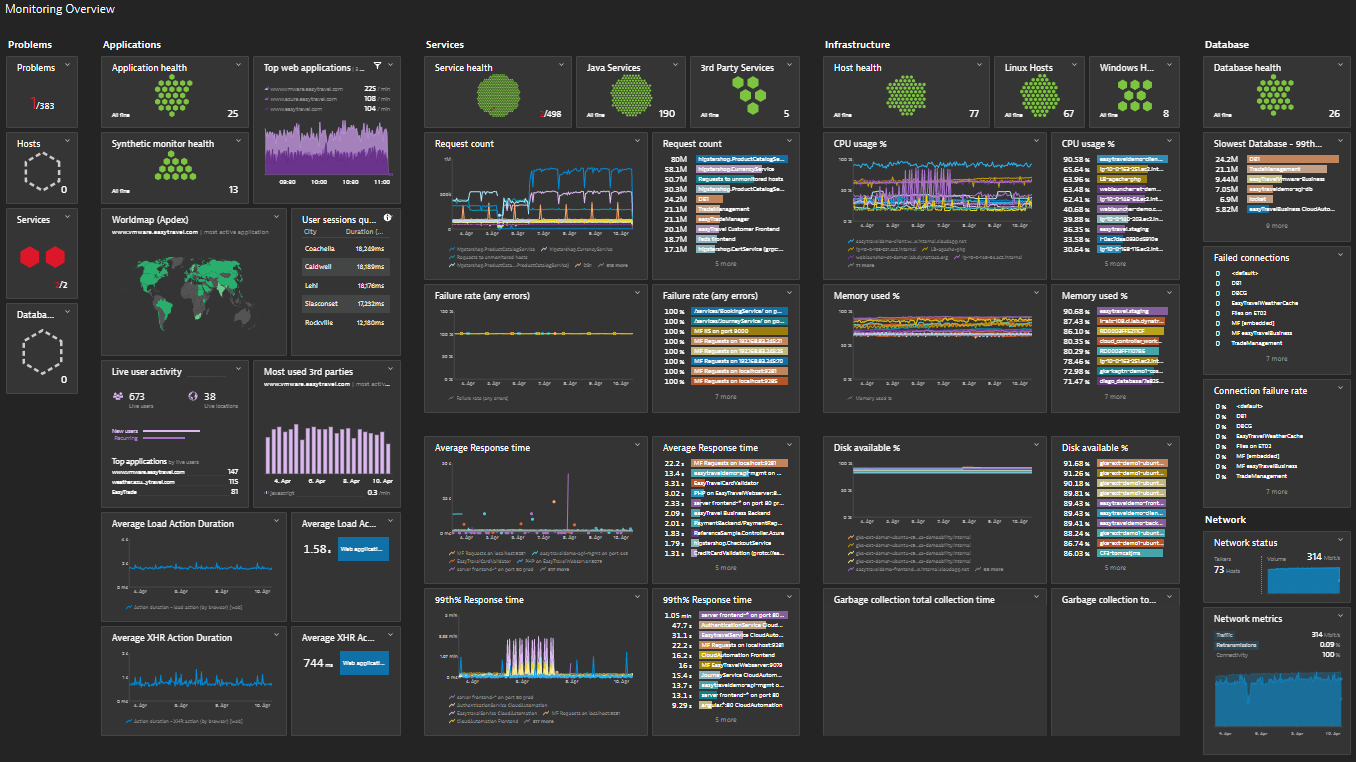
Source: Dynatrace
Datadog is a commercial Kubernetes monitoring and observability platform that provides visibility into Kubernetes infrastructure, applications, and security. It helps organizations monitor the health and performance of Kubernetes clusters across cloud-native and hybrid environments.
Key features include:

Source: Datadog
Kube-state-metrics (KSM) is an open-source Kubernetes monitoring service that generates metrics from the state of Kubernetes API objects. Instead of monitoring resource usage or component health directly, it exposes information about Kubernetes objects such as pods, deployments, nodes, replica sets, jobs, and statefulsets.
Key features include:
Prometheus is an open-source monitoring and alerting platform for collecting, storing, querying, and analyzing time-series metrics from systems and applications. Originally developed at SoundCloud and maintained under the Cloud Native Computing Foundation (CNCF), Prometheus is widely used for Kubernetes monitoring. It uses a pull-based architecture to scrape metrics from configured targets and stores them as labeled time-series data.
Key features include:
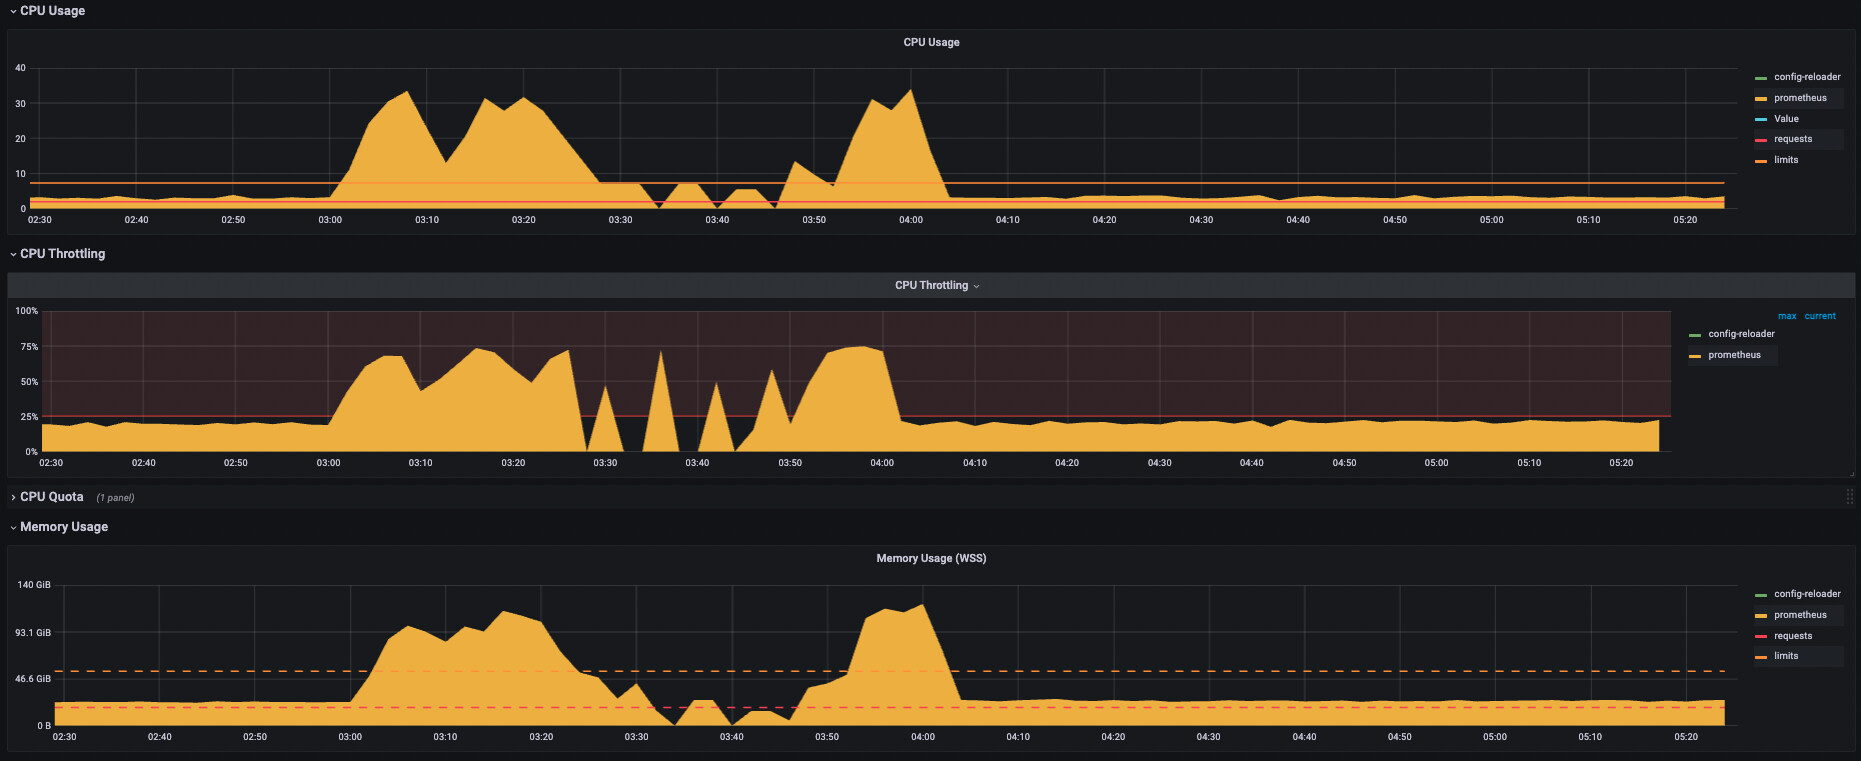
Source: Prometheus

Grafana is an observability and Kubernetes monitoring platform that provides visibility into Kubernetes infrastructure, applications, logs, metrics, and traces. Through Grafana Cloud, organizations can monitor Kubernetes clusters using prebuilt dashboards, automated alerting, and full-stack observability features. Grafana integrates with Prometheus, Loki, OpenCost, and other cloud-native tools to help teams troubleshoot incidents, optimize resource usage, and reduce infrastructure costs.
Key features include:
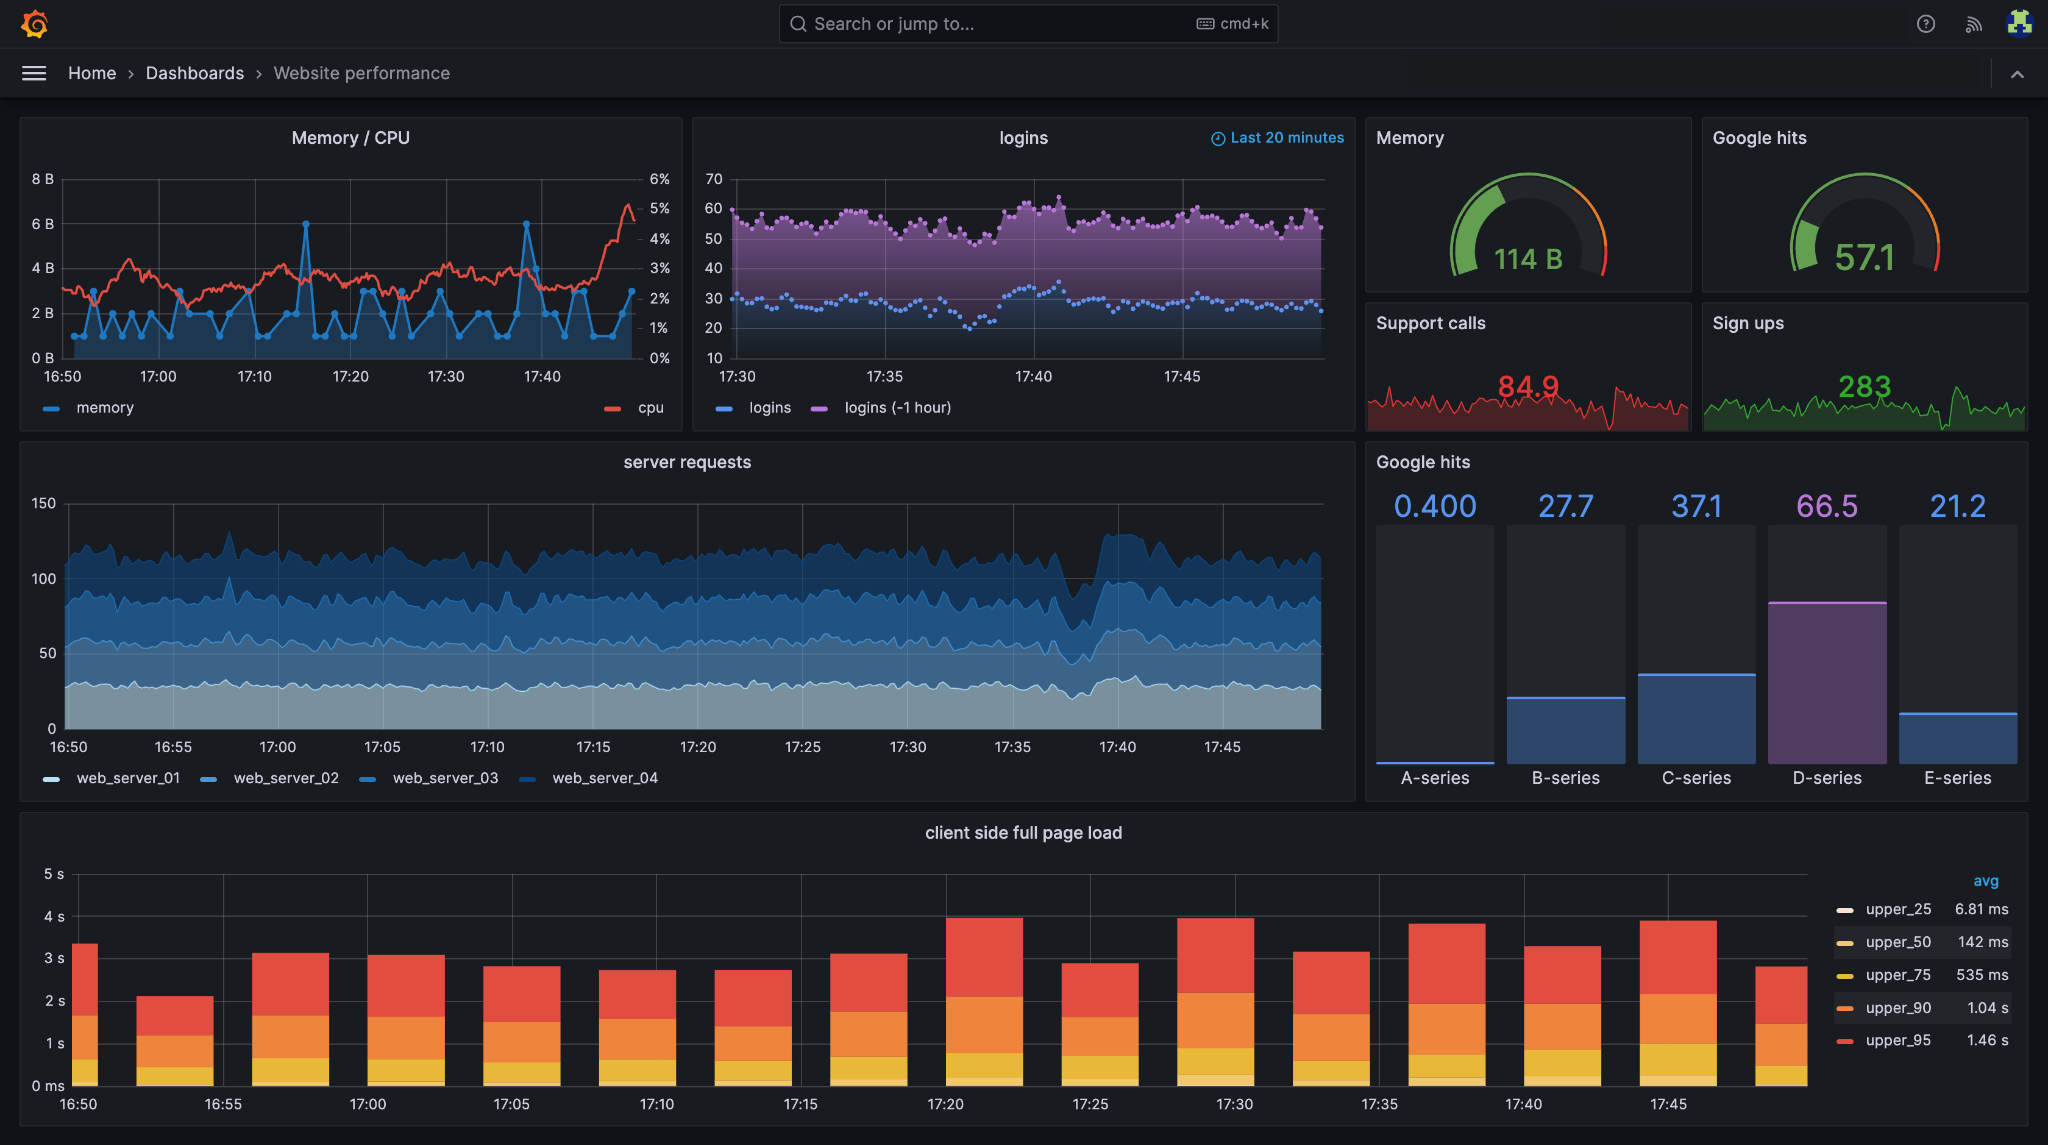
Source: Grafana
Related content: Read our guide to Kubernetes monitoring tools
Kubernetes resource requests and limits affect scheduling, performance, and infrastructure efficiency. Monitoring the difference between requested resources and actual usage helps teams understand whether workloads are consuming what they were allocated. Large gaps often indicate inefficient configurations that waste cluster capacity.
Tracking these metrics also helps prevent resource contention and application instability. Workloads with insufficient memory or CPU requests may experience throttling, evictions, or degraded performance during traffic spikes. Continuous monitoring allows teams to adjust requests and limits based on workload behavior.
Overprovisioned workloads reserve more resources than needed, increasing infrastructure costs and reducing cluster efficiency. Underprovisioned workloads may suffer from CPU throttling, memory pressure, or application crashes. Monitoring resource utilization helps teams identify both scenarios and balance performance with cost efficiency.
Historical usage trends help identify long-term patterns. Teams can analyze average and peak utilization to right-size workloads and improve cluster utilization. Automated optimization tools and recommendation engines can assist with identifying inefficient resource allocations.
Not all resource inefficiencies have the same operational impact. Monitoring should prioritize workloads with configurations that create the highest risk or waste, such as missing resource limits, excessive memory requests, or unstable autoscaling behavior. These workloads are more likely to cause node instability, failed scheduling, or unnecessary infrastructure spending.
Risk prioritization helps teams focus remediation efforts. For example, production workloads with high traffic and no memory limits pose a greater operational risk than low-priority development workloads. Visibility into configuration quality across namespaces and teams improves governance and cluster reliability.
Kubernetes autoscaling mechanisms such as the horizontal pod autoscaler (HPA), vertical pod autoscaler (VPA), and cluster autoscaler rely on monitoring data. Tracking autoscaling behavior helps teams verify that workloads scale correctly during changing traffic conditions and that scaling events occur at appropriate thresholds.
Monitoring autoscaling also helps identify issues such as delayed scaling responses, scaling oscillations, or resource shortages that prevent successful scaling. By analyzing scaling activity alongside performance metrics, teams can adjust autoscaler settings and improve application responsiveness under load.
Resource optimization changes should be validated using metrics, logs, and traces after deployment. Reducing CPU or memory allocations without validation can introduce latency, instability, or failures. Observability data helps confirm whether optimization efforts improved efficiency without negatively affecting application performance.
Continuous validation is important because workload behavior changes over time. Traffic patterns, application updates, and infrastructure changes can alter resource requirements. Monitoring the impact of configuration changes allows teams to make data-driven adjustments and maintain a balance between reliability, performance, and cost efficiency.
Kubernetes monitoring is critical for ensuring the stability and performance of highly dynamic, distributed environments. A robust strategy involves collecting and correlating essential telemetry (metrics, logs, traces, and events) to gain deep visibility. Overcoming common challenges like data volume requires adopting best practices such as continuous resource optimization. By prioritizing key metrics and validating changes with observability data, teams can enhance availability and drive greater cost efficiency.
Kubernetes monitoring is the process of collecting and analyzing metrics, logs, traces, and events from your clusters, nodes, pods, and applications. It gives you visibility into whether workloads are healthy, resources are being used efficiently, and the cluster is stable.
It goes further than checking whether services are running. Kubernetes environments are highly dynamic - containers start, stop, and move between nodes constantly. Effective monitoring tracks this activity automatically, alerts teams when something goes wrong, and provides the data needed to troubleshoot failures and optimize resource usage.
Monitoring and observability are related but answer different questions.
Monitoring collects predefined metrics and alerts you when something crosses a threshold. It tells you that a pod is restarting too often or that memory usage is too high. It is reactive - you know something is wrong, but not necessarily why.
Observability is broader. It combines metrics, logs, and traces to help you understand the internal state of your system based on what it outputs. It lets you ask new questions about system behavior and trace the root cause of a problem across multiple services. Monitoring tells you when something breaks. Observability helps you figure out what caused it.
Kubernetes metrics fall into five layers, each covering a different part of the stack:
The most actionable starting point for most teams is the gap between resource requests and actual usage at the pod level. That is where most waste and instability originates.
Monitoring tells you what is happening. PerfectScale by DoiT tells you what to do about it - and then does it automatically.
PerfectScale continuously analyzes resource usage across every workload in your cluster, detects misconfigurations and performance risks like OOM kills, CPU throttling, memory leaks, and pods hitting max replica counts, and remediates them before they cause incidents. It also fine-tunes autoscaling configurations and right-sizes CPU and memory requests in real time based on actual demand - reducing cloud costs by up to 50% while maintaining 99.99% availability.