
PerfectScale
kubectl logs: How to View and Debug Pod Logs in Kubernetes
This page is also available in Deutsch, Español, Français, Italiano, 日本語, and Português.


About Josh Palmer
Head of Content
I'm Josh Palmer, Head of Content at DoiT, where I split my time across multiple business units including DoiT Cloud Intelligence, PerfectScale (Kubernetes cost optimization), and SELECT (Snowflake, Databricks, and BigQuery cost optimization). Before DoiT, I spent four and a half years at OnBoard building content for a board intelligence platform used by 6,000+ organizations, and before that, two years as Content Marketing Manager at Zylo, a SaaS management platform.
My personal pagekubectl logs lets you read the logs of a container running in a pod. The container runtimes capture what the application writes to standard output (stdout) and standard error (stderr) and make those logs available through the kubelet. kubectl logs is the usual way to access them.
You don't need to SSH into a node and search through log files just to read a container's logs.
In this guide, you'll learn how Kubernetes stores and provides container logs, the important kubectl logs flags, how to get logs from individual pods and larger workloads, how to follow and filter log output, how to read logs from a previous container instance, and how to access node-level logs. Just as importantly, you'll learn about the failures that kubectl logs cannot show you.
What is the kubectl logs command?
The command prints the logs for a container in a pod. If the pod has only one container, you don't need to specify the container name. If it has multiple containers, you can use -c to choose which container's logs you want.
The basic command is simple:
kubectl logs <pod-name>For a pod with one container, this is enough.
kubectl logs can also read logs from a specified resource, such as a Deployment or Job, and it can stream new log output with -f. You can also use -p to read logs from the previous instance of a container when that instance has terminated, and its logs are still available.
The important thing to understand is that kubectl logs is not a long-term log storage system. Kubernetes keeps container logs on the node and makes them available through the kubelet. Kubernetes periodically rotates those logs, and they can be lost when a pod is removed from a node. For long-term storage and searching, Kubernetes recommends using a separate cluster-level logging solution.
How does Kubernetes store and serve container logs?
Kubernetes does not collect logs from inside your application. It relies on a simple mechanism. Your application writes to standard output (stdout) and standard error (stderr), and the container runtime captures those two streams. That is how Kubernetes gets the container's logs. If your application writes its logs to a file inside the container instead, kubectl logs cannot read them, which is a common cause of empty output.
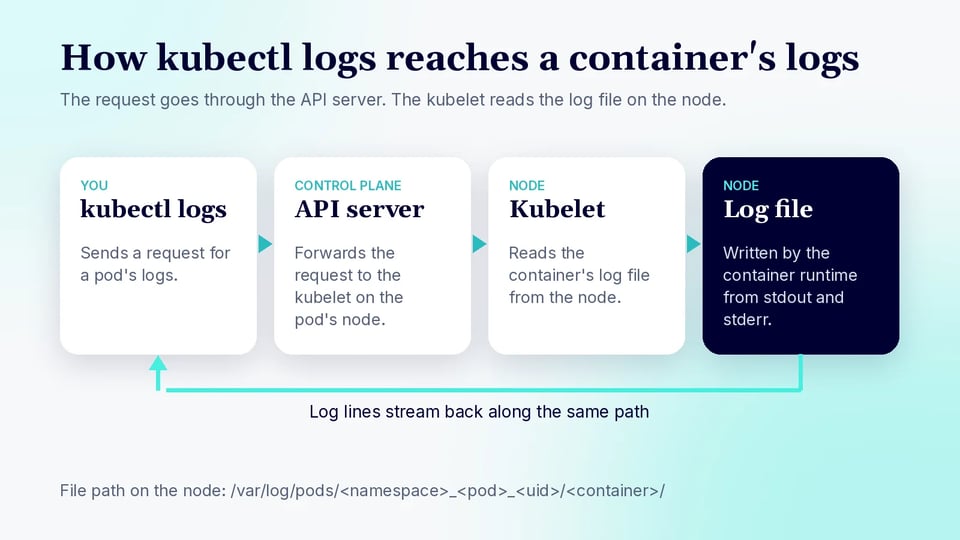
When you run kubectl logs, the request goes to the API server, which forwards it to the kubelet on the node where the pod runs. The kubelet reads the container's log file from the node and streams it back to you. The container runtime wrote that file, storing stdout and stderr in the CRI (Container Runtime Interface) log format. The runtime writes each container's log file on the node at this path:
/var/log/pods/<namespace>_<pod>_<uid>/<container>/The kubelet also creates a symlink under /var/log/containers/ that log-shipping tools read, though kubectl logs itself always reads the real file under /var/log/pods.
Each line in the file uses the CRI format, which has four parts:
2026-07-24T09:14:03.123Z stdout F Listening on :8080These parts are the timestamp, stream (stdout or stderr), tag, and message. The tag shows whether the log line is complete. F means the line is complete, while P means the line is only part of a longer line.
For example, if an application writes a log line larger than Containerd's 16 KB limit, Containerd splits it into multiple entries:
2026-07-24T09:14:03.123Z stdout P {"message":"This is a very long log...2026-07-24T09:14:03.124Z stdout P ...that continues here...2026-07-24T09:14:03.125Z stdout F ...and ends here."}The first two entries are marked P because they are partial, and the last entry is marked F because it completes the original log line. So if a log collector shows one long JSON log as several entries, Containerd may have split it because it exceeded the size limit.
There are two important things to know about how logs are stored, and both affect how you use the command.
First, logs live on the node, and the kubelet rotates them. By default, it keeps up to 5 files per container, each up to 10 MiB (containerLogMaxFiles and containerLogMaxSize), and once these limits are reached, the oldest entries are deleted.
Second, logs do not outlive the pod. When a pod is deleted, the kubelet removes its log files, and a pod replaced on another node starts with no earlier logs. As a result, kubectl logs can only show what is currently on the node.
kubectl logs syntax and option reference
The full syntax is:
kubectl logs [-f] [-p] (POD | TYPE/NAME) [-c CONTAINER] [flags]You provide either a pod name or a workload reference such as deployment/api, an optional container with -c, and any flags. The rule for containers is simple: if the pod has one container you do not name it, and if it has more than one you must.
The flags you will use most often are these:
| Flag | What it does | Default or note |
|---|---|---|
-c, --container |
Read a specific container | Required for multi-container pods |
--all-containers=true |
Read every container in the pod | Add --prefix to tell them apart |
-f, --follow |
Stream new lines as they are written | Ctrl+C to stop |
-p, --previous |
Read the previous, terminated container | Only one previous instance is kept |
--tail=N |
Show only the last N lines | -1 (all) for one pod; 10 with a selector |
--since=DURATION |
Logs from a relative time (1h, 5m) |
No default; cannot be used with --since-time |
--since-time=TIME |
Logs after an RFC3339 timestamp | No default |
--timestamps |
Add a timestamp to every line | For applications that do not add their own |
--prefix |
Add the pod and container name to every line | Useful with selectors and --all-containers |
-l, --selector |
Logs from all pods matching a label | Defaults --tail to 10 per container |
--all-pods=true |
Logs from every pod of a workload | Adds a source prefix automatically |
--max-log-requests=N |
Concurrent streams when using a selector | 5; raise it if the label matches more pods |
--limit-bytes=N |
Cap output at N bytes | For a quick look at a very large log |
--ignore-errors |
Keep streaming if one source errors | Useful with -f across many pods |
--pod-running-timeout=DURATION |
How long to wait for a pod to be Running | 20s |
--insecure-skip-tls-verify-backend |
Read logs despite a bad kubelet certificate | For expired kubelet serving certificates |
Common kubectl logs commands
| Command | What it does | Note |
|---|---|---|
kubectl logs <pod> |
Shows logs from the pod's only container, or the first container if you don't specify one. | You don't need to provide the container name when the pod has only one container. |
kubectl logs <pod> -c <container> |
Shows logs from a specific container in the pod. | Required when the pod has more than one container. |
kubectl logs <pod> --all-containers=true |
Shows logs from all containers in the pod. | It can be difficult to tell which container a log line came from. Add --prefix to make it easier. |
kubectl logs -f <pod> |
Streams new log messages as they are written. | Works like tail -f. Press Ctrl+C to stop following the logs. |
kubectl logs -p <pod> |
Shows logs from the previous container after it has crashed. | This is one of the first commands to use when troubleshooting a CrashLoopBackOff. |
kubectl logs --tail=20 <pod> |
Shows only the last 20 log lines. | Useful when a pod generates a lot of logs. |
kubectl logs --since=1h <pod> |
Shows logs from the last hour. | You can also use values like 5s, 2m, or 3h. |
kubectl logs --since-time=<timestamp> <pod> |
Shows logs written after a specific time. | The timestamp must be in RFC3339 format. |
kubectl logs --timestamps <pod> |
Adds a timestamp to every log line. | Helpful when your application doesn't include timestamps in its logs. |
kubectl logs -l app=nginx --all-containers=true |
Shows logs from all pods that match the label. | Great when your application is running in multiple pods. |
kubectl logs deployment/nginx |
Shows logs from a Deployment. | By default, Kubernetes picks one pod from the Deployment. |
kubectl logs deployment/nginx --all-pods=true |
Shows logs from every pod in the Deployment. | This newer kubectl flag also adds a source prefix to each log line. |
kubectl logs job/hello |
Shows logs from the pod created by a Job. | Useful for one-time or batch workloads. |
kubectl logs -l app=nginx --max-log-requests=10 |
Increases the number of log streams that can be opened at the same time. | The default limit is 5 when following logs by label. |
Fetching logs from pods, workloads, and label selectors
kubectl logs reads logs from one pod at a time by default. If the pod is in another namespace, use -n:
kubectl logs api-7f89c7d9d-xk8rt -n productionThe output shows your application's log lines in the order they were written. Kubernetes does not reformat them, so how readable they are depends on how your application writes them.
You can also point kubectl logs at a workload instead of a pod:
kubectl logs deployment/api -n productionThis does not show every pod. Kubernetes selects one and prints a line such as Found 3 pods, using pod/api-7f89c7d9d-xk8rt. The same works with statefulset/, daemonset/, and job/. The job/ form is useful for checking logs from one-time batch jobs.
To read logs across many pods at once, use a label selector:
kubectl logs -l app=api --all-containers=true --prefixBy default, kubectl logs shows the last 10 lines per container and reads from up to 5 pods at a time. If the selector matches more than 5 pods, increase --max-log-requests or the command will fail.
In a multi-container pod, you select the container with -c:
kubectl logs api-7f89c7d9d-xk8rt -c app-c is not only for the main application container. It also reads init containers, which is how you debug a pod stuck in Init:
kubectl logs <pod> -c <init-container-name>It reads native sidecar containers as well. A native sidecar is an init container with restartPolicy: Always, a feature that became stable in Kubernetes 1.33. A sidecar is defined in the pod's initContainers list; you read its logs the same way, by name with -c.
If you are not sure of the container names, list them:
kubectl get pod <pod> -o jsonpath='{.spec.initContainers[*].name} {.spec.containers[*].name}'Filtering, tailing, and streaming log output
The -f flag streams new log lines as they are written, similar to tail -f. You have to press Ctrl+C to stop. This is useful when you want to watch requests flow through an application in real time:
kubectl logs -f <pod>For an application that logs a lot, avoid printing everything. You should use --tail that shows the last N lines, and --limit-bytes caps the raw output size:
kubectl logs --tail=50 <pod>kubectl logs --limit-bytes=10000 <pod>To scope by time, --since takes a relative window and --since-time takes an exact timestamp. You should use one of them, not both:
kubectl logs --since=15m <pod>kubectl logs --since-time=2026-07-24T09:00:00Z <pod>Scoping by time also puts less load on your cluster than streaming everything.
When output comes from more than one source, label it. --prefix adds the pod and container name to each line, --timestamps adds a timestamp, and --all-pods=true reads every pod of a workload and enables the prefix automatically:
kubectl logs deployment/api --all-pods=true --timestampsReading logs from crashed, restarted, and completed pods
When a container crashes and restarts, the logs from the previous container instance contain the error that caused the crash. You use -p to read those logs:
kubectl logs -p <pod>This is the first command to run for a CrashLoopBackOff. It is where you find the missing environment variable, the configuration file that could not be loaded, or the stack trace that explains the crash.
kubectl logs also works on pods that have finished, not only running ones. A completed Job pod or a failed pod still has its logs, as long as the pod object still exists and the node has not rotated the logs away. This is how you find out why a batch job failed.
But there is a limit because logs are stored on the node, rotated by the kubelet, and removed when the pod is deleted. kubectl logs cannot show logs from a pod that ran last week or has already been replaced. Once the pod and its logs are gone, kubectl logs cannot recover them. This is why logs should be shipped to a separate logging system for long-term storage.
Searching and parsing kubectl logs output
kubectl logs prints plain text, so you can pipe it to other commands. To show only lines that contain "error", or to save the output for later:
kubectl logs <pod> | grep -i errorkubectl logs <pod> > pod.logIf your application logs in JSON, jq lets you query the output instead of reading it line by line. For example, to show only error-level entries and print one field from each:
kubectl logs <pod> | jq 'select(.level=="error") | .msg'This is the main reason to log in a structured format.
Querying node and kubelet logs with kubectl logs
The Pod logs do not cover the node's own services, such as the kubelet and the container runtime. The Node log query feature lets you read those through the API without connecting to the node directly. It was introduced in Kubernetes 1.27, went to beta in 1.30, and is GA as of 1.36. On 1.36 and later the NodeLogQuery feature gate is enabled by default; you still set the kubelet options enableSystemLogHandler and enableSystemLogQuery to true. On older clusters, enable the NodeLogQuery feature gate as well. Once it is enabled, you query node logs with kubectl get --raw:
# kubelet logs from a nodekubectl get --raw "/api/v1/nodes/<node-name>/proxy/logs/?query=kubelet"
# container runtime logskubectl get --raw "/api/v1/nodes/<node-name>/proxy/logs/?query=containerd"
# filter for a keywordkubectl get --raw "/api/v1/nodes/<node-name>/proxy/logs/?query=kubelet&pattern=error"
On Linux, the kubelet retrieves these logs using journalctl, and on Windows it reads the event log. In order to read node logs, it requires get and create access to nodes/proxy in RBAC.
Node logs matter when the problem is below the pod. A common example is a node that reaches the Ready state, but pods on it never start because of a CNI (networking) misconfiguration. The pod has no logs yet, so kubectl logs shows nothing, and the real error is in the kubelet log. Kubelet or runtime crashes, disk-pressure evictions, and image-mount failures also appear here rather than in a pod's output.
Resource problems that kubectl logs will not show
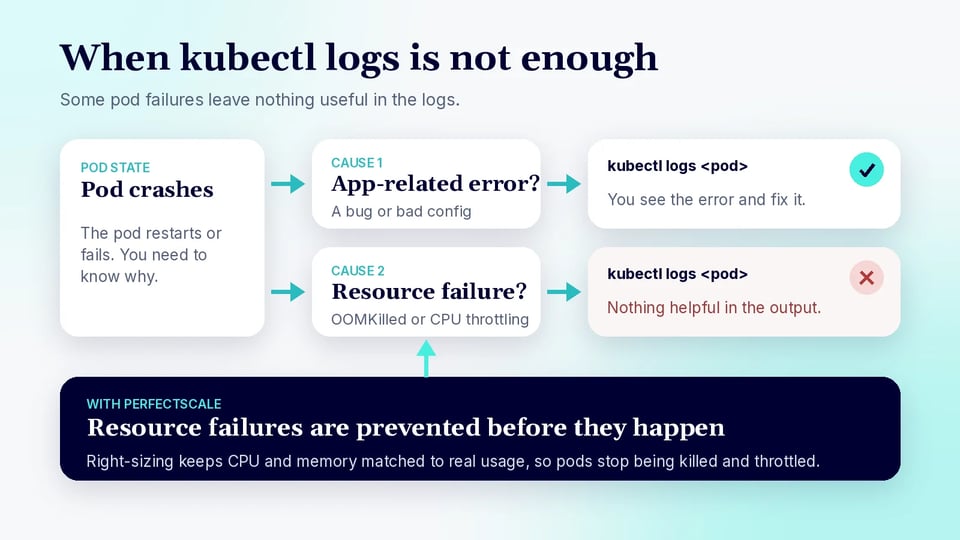
Many pod failures leave no log at all, because they happen to the container rather than inside it. kubectl logs shows what your application printed, and an application that is killed or throttled usually prints nothing useful.
The clearest example is an OOMKilled container. When a container uses more memory than its limit, the kernel kills it, and the application does not get a chance to log anything. The kubectl logs and kubectl logs -p may be empty or incomplete. In this case, check the pod's state instead:
kubectl describe pod <pod>
Last State:     Terminated  Reason:       OOMKilled  Exit Code:    137
Exit code 137 means the container was killed with SIGKILL, which usually means it ran out of memory. kubectl logs does not show this; the pod's state does.
CPU throttling is different. When a container reaches its CPU limit, the kernel slows it down instead of stopping it. The container keeps running, so there may be no error in the logs. You may instead see higher p99 latency without seeing more errors in the logs. Metrics such as container_cpu_cfs_throttled_periods_total can show the throttling.
Due to the above cases, you have to look at the pod's state and events whenever the logs are empty or do not explain a failure. kubectl describe pod <pod> shows the restart count, the last exit code, and recent events. kubectl events, or kubectl get events --sort-by=.lastTimestamp, shows what Kubernetes did, such as scheduling, image pulls, evictions, and OOM kills. Logs and events together give the full picture.
There is also a cost to streaming logs at scale. Every kubectl logs request goes through the API server to the kubelet, and --follow keeps the connection open. Streaming logs from hundreds of pods or polling them frequently can put extra load on the API server. This is why --max-log-requests defaults to 5 and why it helps to limit requests with --since and --tail.
Tools that extend Kubernetes log and resource visibility
The following tools help with resource issues, multiple pods, and long-term log storage:
PerfectScale
PerfectScale helps with failures that do not appear in application logs. Many pod restarts are caused by resource problems, such as OOMKilled or CPU throttling, rather than application bugs. These problems may not leave anything useful in the logs. PerfectScale's Kubernetes governance platform watches how your workloads actually use CPU and memory, identifies these resource-caused failures, and turns them into actionable, automated right-sizing recommendations that you can apply manually or autonomously. Pods then stop being killed and throttled in the first place, which means fewer restarts to investigate and fewer empty crash logs to read. Teams like Paramount Pictures and Creditas use PerfectScale to optimize their clusters. You can sign up or book a technical session.
Stern
Stern tails logs from many pods at once, with color-coded output. It is easier to work with than kubectl logs -l when you are watching several pods during a rollout.
Grafana Loki
Grafana Loki stores logs centrally and makes them searchable. It lets you read logs from a pod that ran last week, which kubectl logs cannot do.
Fluent Bit
Fluent Bit is a lightweight log collector, usually run as a DaemonSet. It reads each node's container logs and ships them to a store such as Loki or Elasticsearch before rotation deletes them.
Best practices for using kubectl logs
Here are some best practices to follow when using kubectl logs:
1. Write application logs to stdout and stderr
You have to avoid writing logs to files inside the container and use a structured format such as JSON, which also makes logs easier to search and process with tools like jq and Loki.
2. Scope every request with --since and --tail before streaming
You should avoid printing a pod's entire history when you only need the last few minutes. It is faster for you and puts less load on the API server.
3. Check the pod status before reading its logs
You should use kubectl get pod and kubectl describe pod to check restarts and exit codes. For example, an OOMKilled container may not have useful logs.
4. Send logs to a central store
The logs are stored on the node and can be removed during rotation or when the pod is deleted. A central logging system keeps them available for longer.
5. Restrict access to the pods/log subresource with RBAC
Users need access to the pods/log resource to view pod logs. Give this permission only where it is needed, because logs may contain sensitive information.
Troubleshooting common kubectl logs errors
Here are some common kubectl logs errors and how to troubleshoot them:
Multiple containers in the pod
If a pod has more than one container, specify the container with -c <container>. To view logs from all containers, use --all-containers=true.
Empty log output
The empty output usually has one of three causes. The application may be writing logs to a file instead of stdout or stderr, you may be checking the wrong container, or the application may not have written any logs yet. You should check where the application writes its logs and confirm the container name.
Kubelet certificate errors
These errors usually mean the API server cannot connect to the kubelet because its serving certificate is expired or not trusted. The proper fix is to repair the certificate. As a temporary workaround, --insecure-skip-tls-verify-backend skips the certificate check, but it should not be used as the permanent solution.