Table of Content
Subscribe to our newsletter
Thank you! Your submission has been received!
Oops! Something went wrong while submitting the form.
Kubernetes cost monitoring is the process of tracking, analyzing, and optimizing the spending associated with running workloads on Kubernetes clusters. Unlike traditional infrastructure, Kubernetes abstracts compute, storage, and networking resources, which makes it challenging to understand exactly where money is being spent. Cost monitoring tools and practices help organizations attribute expenses to specific teams, applications, or projects and identify areas where resources are being over- or underutilized.
Kubernetes cost monitoring provides visibility into resource consumption at various levels, such as clusters, namespaces, and workloads. This visibility supports budgeting, forecasting, and optimizing cloud infrastructure spend. By breaking down costs and tying them directly to business units or environments, organizations can make informed decisions to control and reduce their Kubernetes-related expenses while maintaining performance and availability.
This is part of a series of articles about Kubernetes cost optimization
In this article:
Kubernetes clusters are designed to run workloads from multiple teams or applications on shared infrastructure. This multi-tenancy approach maximizes resource utilization but complicates cost allocation. Unlike traditional environments, where each application might have dedicated resources, Kubernetes dynamically schedules workloads across nodes, making it hard to tie specific infrastructure costs back to individual teams or projects.
This shared model means that a single node might host pods from several different namespaces or teams, each consuming varying amounts of CPU, memory, and storage. Without granular cost monitoring tools, organizations struggle to split the total cloud bill accurately and assign costs in a way that reflects actual usage, leading to challenges in chargeback and showback processes.
Kubernetes provides features like resource requests and limits to ensure workload reliability, but these often result in overprovisioning. Developers tend to request more resources than necessary to avoid performance issues, which leads to unused but reserved capacity. This unused allocation drives up costs since cloud providers charge based on provisioned resources, not just actual usage.
Overprovisioning is further exacerbated by the need to maintain headroom for scaling and failover scenarios. While this helps maintain service reliability, it also means organizations pay for resources that may remain idle most of the time. Monitoring tools must account for the gap between requested and used resources to highlight opportunities for rightsizing and cost savings.
Cloud provider invoices typically summarize costs at the VM, disk, or network level without breaking them down by Kubernetes workload, namespace, or team. This lack of workload-level context makes it difficult for organizations to understand which applications or environments are driving spending increases. As a result, engineering and finance teams struggle to identify cost drivers and take targeted action.
To address this, organizations need tools that correlate cloud infrastructure costs with Kubernetes objects. This involves collecting and analyzing metrics from both the cloud provider and the Kubernetes cluster, then mapping them together to provide insights at the workload or namespace level.
Kubernetes is designed for dynamic, ephemeral workloads that can scale up or down and move between nodes based on demand. While this flexibility improves resource efficiency, it complicates cost tracking. Workloads may only exist for a short time, and their resource usage can fluctuate rapidly, making it difficult to capture an accurate cost picture using static or infrequent measurements.
The frequent changes in workload scheduling and resource allocation require continuous, real-time cost monitoring. Traditional monthly or weekly reporting is insufficient, as it can miss transient spikes or inefficiencies. Organizations need tools that track costs in near real time and provide historical context to identify trends, anomalies, and optimization opportunities.
Cluster cost is the total expense of running a Kubernetes cluster, covering compute, storage, and network resources. It provides a high-level overview and establishes the baseline cost of the entire platform, including all nodes, persistent volumes, and supporting infrastructure. Monitoring this metric over time is crucial for identifying trends, forecasting future expenses, and evaluating the financial impact of scaling decisions to prevent budget overruns.
Tips for monitoring and improving this metric:
The namespace cost metric helps track expenses for workloads within a specific Kubernetes namespace. Since namespaces often separate environments, teams, or applications, this metric is vital for implementing accurate chargeback and showback models. It enables organizations to allocate costs precisely, holding teams accountable and providing visibility into which projects consume the most resources, supporting targeted budgeting and optimization.
Tips for monitoring and improving this metric:
Pod and workload costs offer the most granular view of spending, translating the resource consumption of individual applications or services (pods and deployments) into actual financial figures. This visibility helps teams understand the direct financial impact of their workloads and enables precise optimization efforts. By focusing on these metrics, organizations can identify high-cost services and take targeted actions like rightsizing or refactoring for better efficiency.
Tips for monitoring and improving this metric:
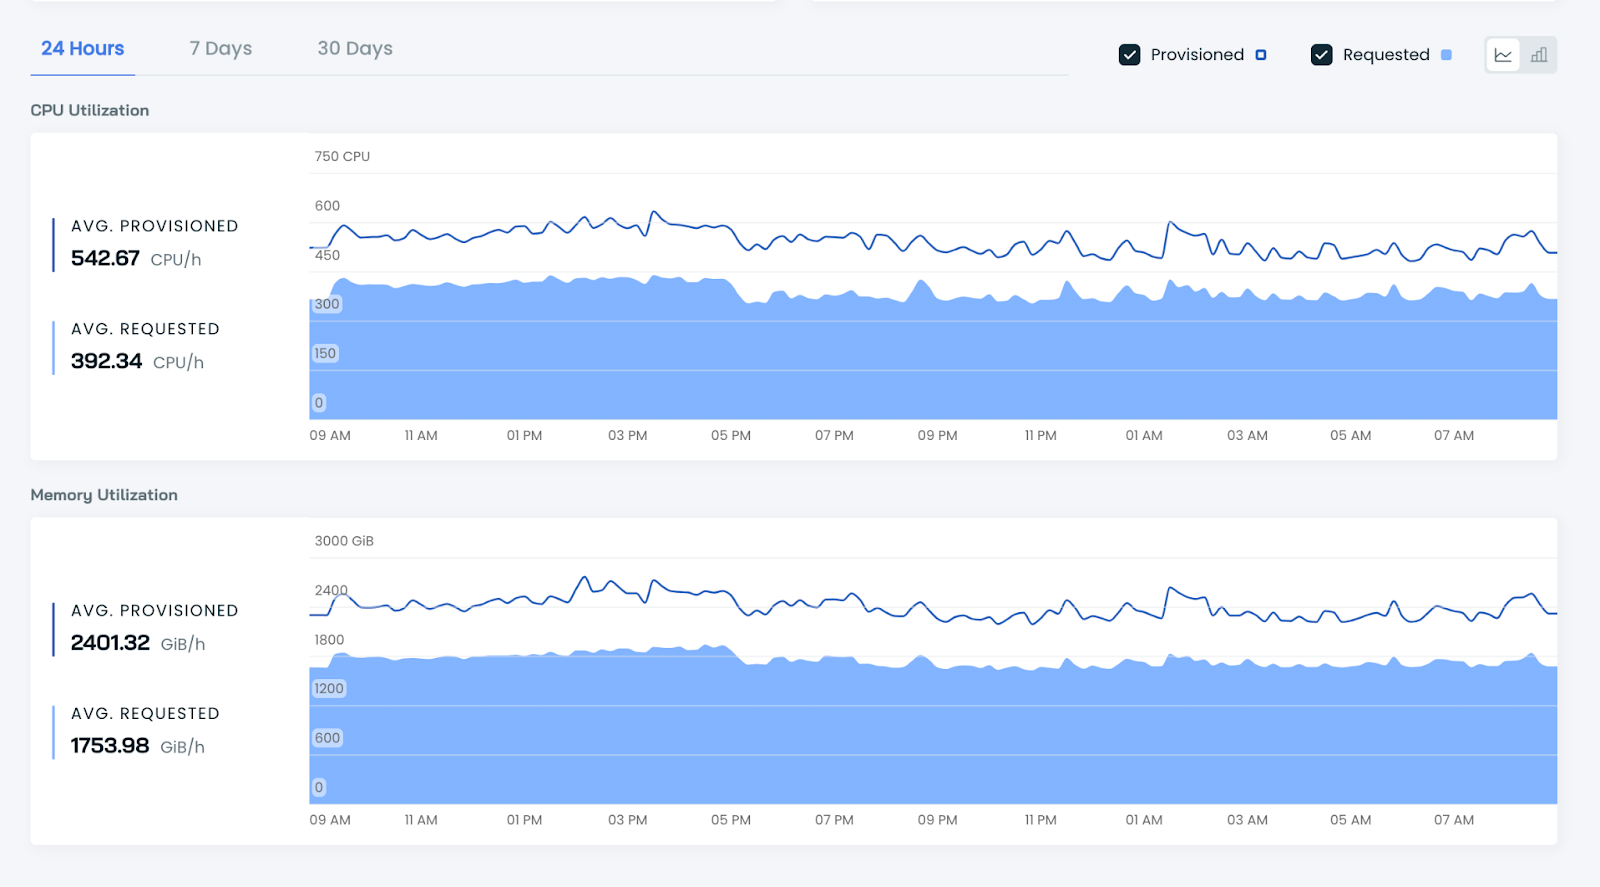
This metric compares the CPU and memory resources requested by a pod with its actual usage. Since Kubernetes schedules based on requests and cloud providers charge for provisioned resources, a large gap indicates overprovisioning and wasted spending. Tracking this difference is fundamental for rightsizing workloads and ensuring resource allocation precisely aligns with demand, which is crucial for lowering cloud bills.
Tips for monitoring and improving this metric:
Idle costs are the expenses incurred for allocated but unused resources, frequently resulting from overprovisioned workloads or inefficient cluster scheduling that leaves nodes running below full capacity. If ignored, these costs can significantly inflate the total cloud bill. Monitoring idle capacity allows organizations to pinpoint utilization inefficiencies and take corrective actions to improve resource density.
Tips for monitoring and improving this metric:
These costs, often overlooked, include expenses from persistent volumes, backups, and network traffic both within the cluster and across cloud regions. Unmonitored, these charges can escalate significantly. Tracking storage and network usage at the cluster, namespace, and workload levels is essential for identifying key cost drivers and making informed adjustments to resource allocation.
Tips for monitoring and improving this metric:
PerfectScale by DoiT is an automated Kubernetes optimization and management platform that continuously right-sizes workloads, eliminates waste, and keeps clusters stable without manual effort. It analyzes resource usage across every workload and autonomously adjusts CPU and memory configurations to reduce cloud costs by up to 50% while maintaining 99.99% availability.
Key features include:
Start optimizing your Kubernetes costs with PerfectScale

CAST AI is a Kubernetes cost monitoring and optimization platform that provides real-time visibility into infrastructure spending, workload efficiency, and resource utilization across Kubernetes clusters. It helps organizations understand how compute, memory, GPU, storage, and networking resources are consumed by different workloads, namespaces, and teams. The platform combines cost monitoring with automation insights, allowing teams to identify inefficiencies, estimate savings opportunities, and optimize cluster configurations.
Key features include:

Source: Cast AI
ScaleOps provides Kubernetes cost monitoring and cost allocation capabilities that give organizations visibility into their Kubernetes spending. The platform breaks down infrastructure costs across clusters, namespaces, teams, applications, labels, and annotations, helping engineering and finance teams understand where cloud budgets are consumed. ScaleOps combines Kubernetes-level insights with native cloud billing integrations, enabling organizations to correlate workload activity with cloud provider invoices. In addition to monitoring, the platform includes optimization tracking and multi-cluster visibility to help teams measure savings and identify inefficiencies across Kubernetes environments.
Key features include:
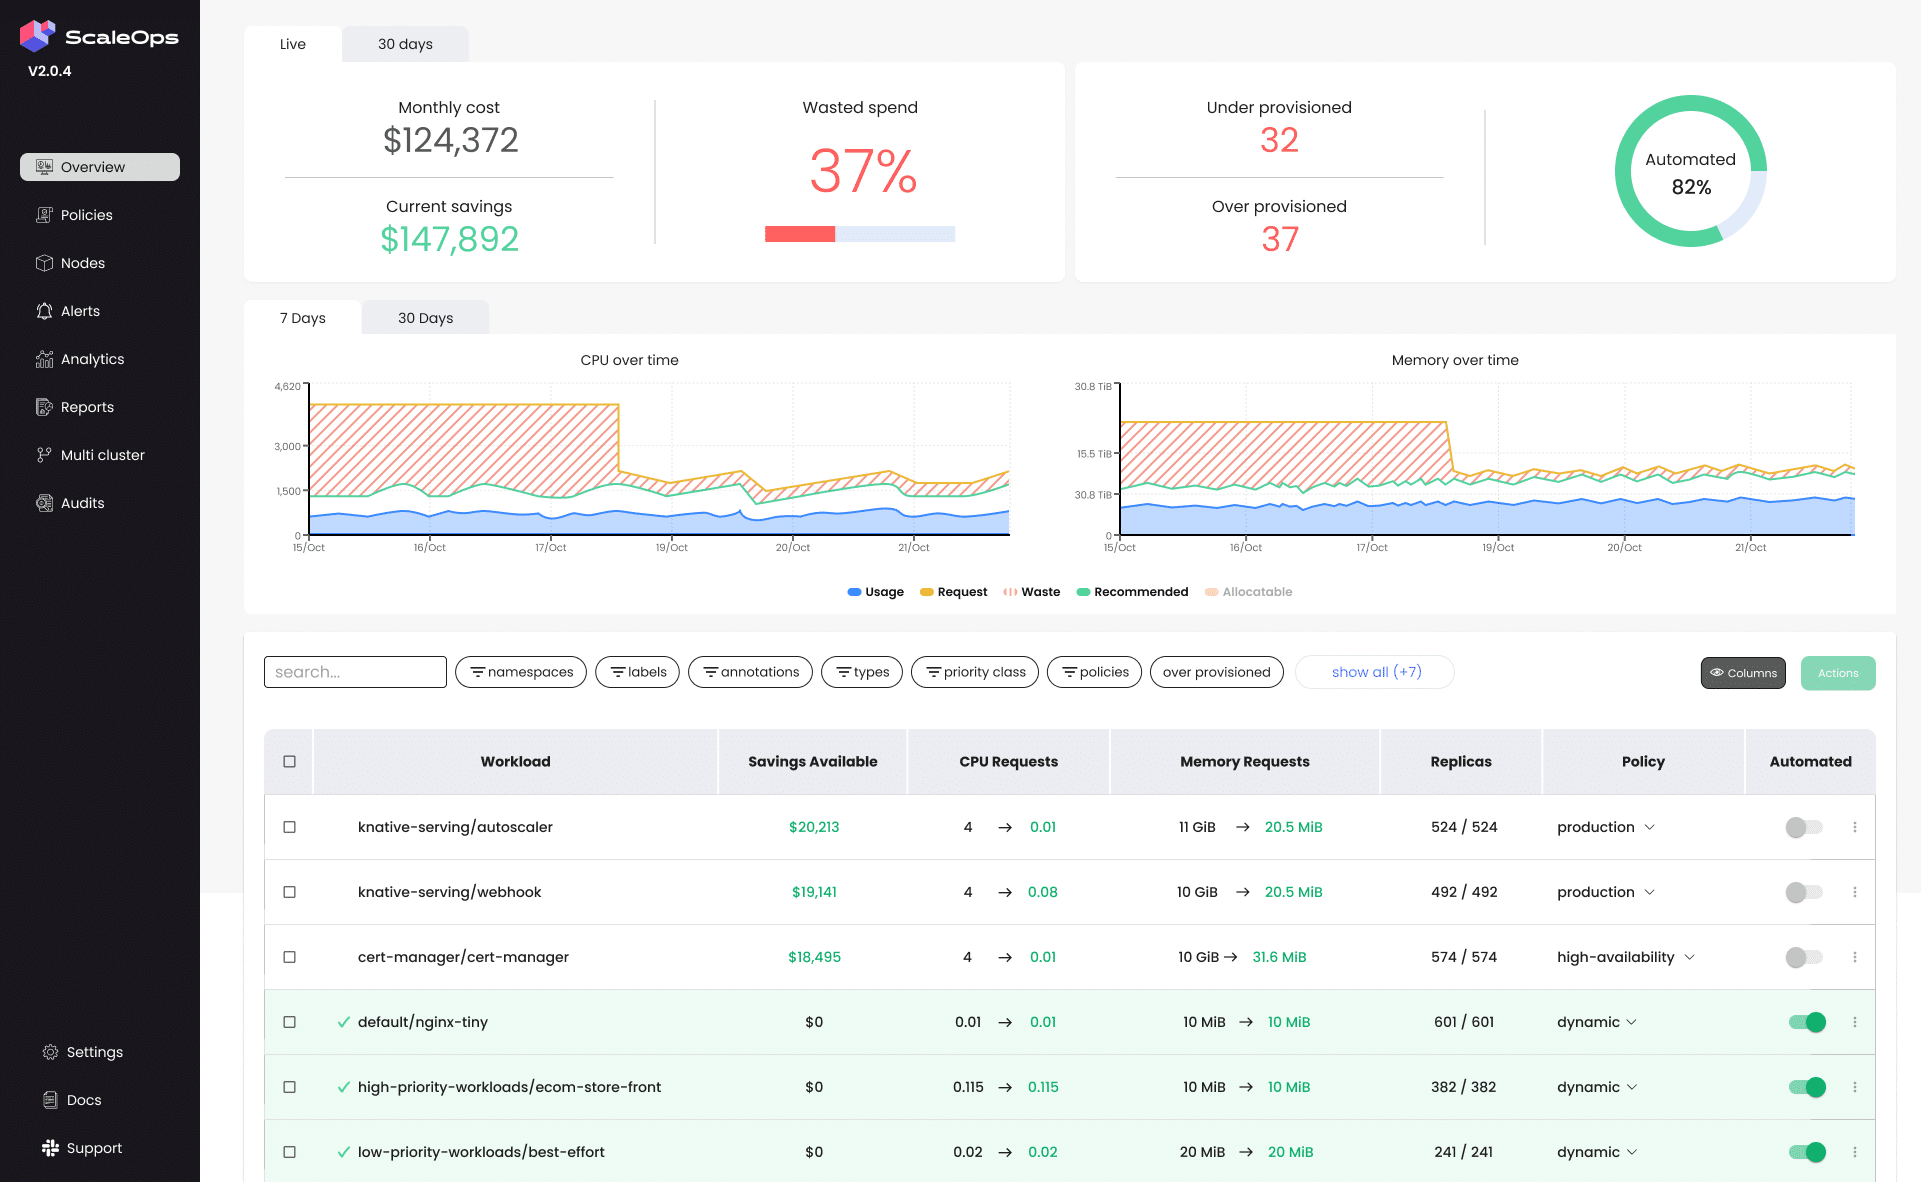
Source: ScaleOps

OpenCost is an open source Kubernetes cost monitoring platform that measures, allocates, and analyzes cloud infrastructure and container costs in real time. As a vendor-neutral project, OpenCost helps organizations understand Kubernetes spending across clusters, namespaces, containers, and cloud resources without being tied to a specific provider or commercial platform.
Key features include:

Source: OpenCost

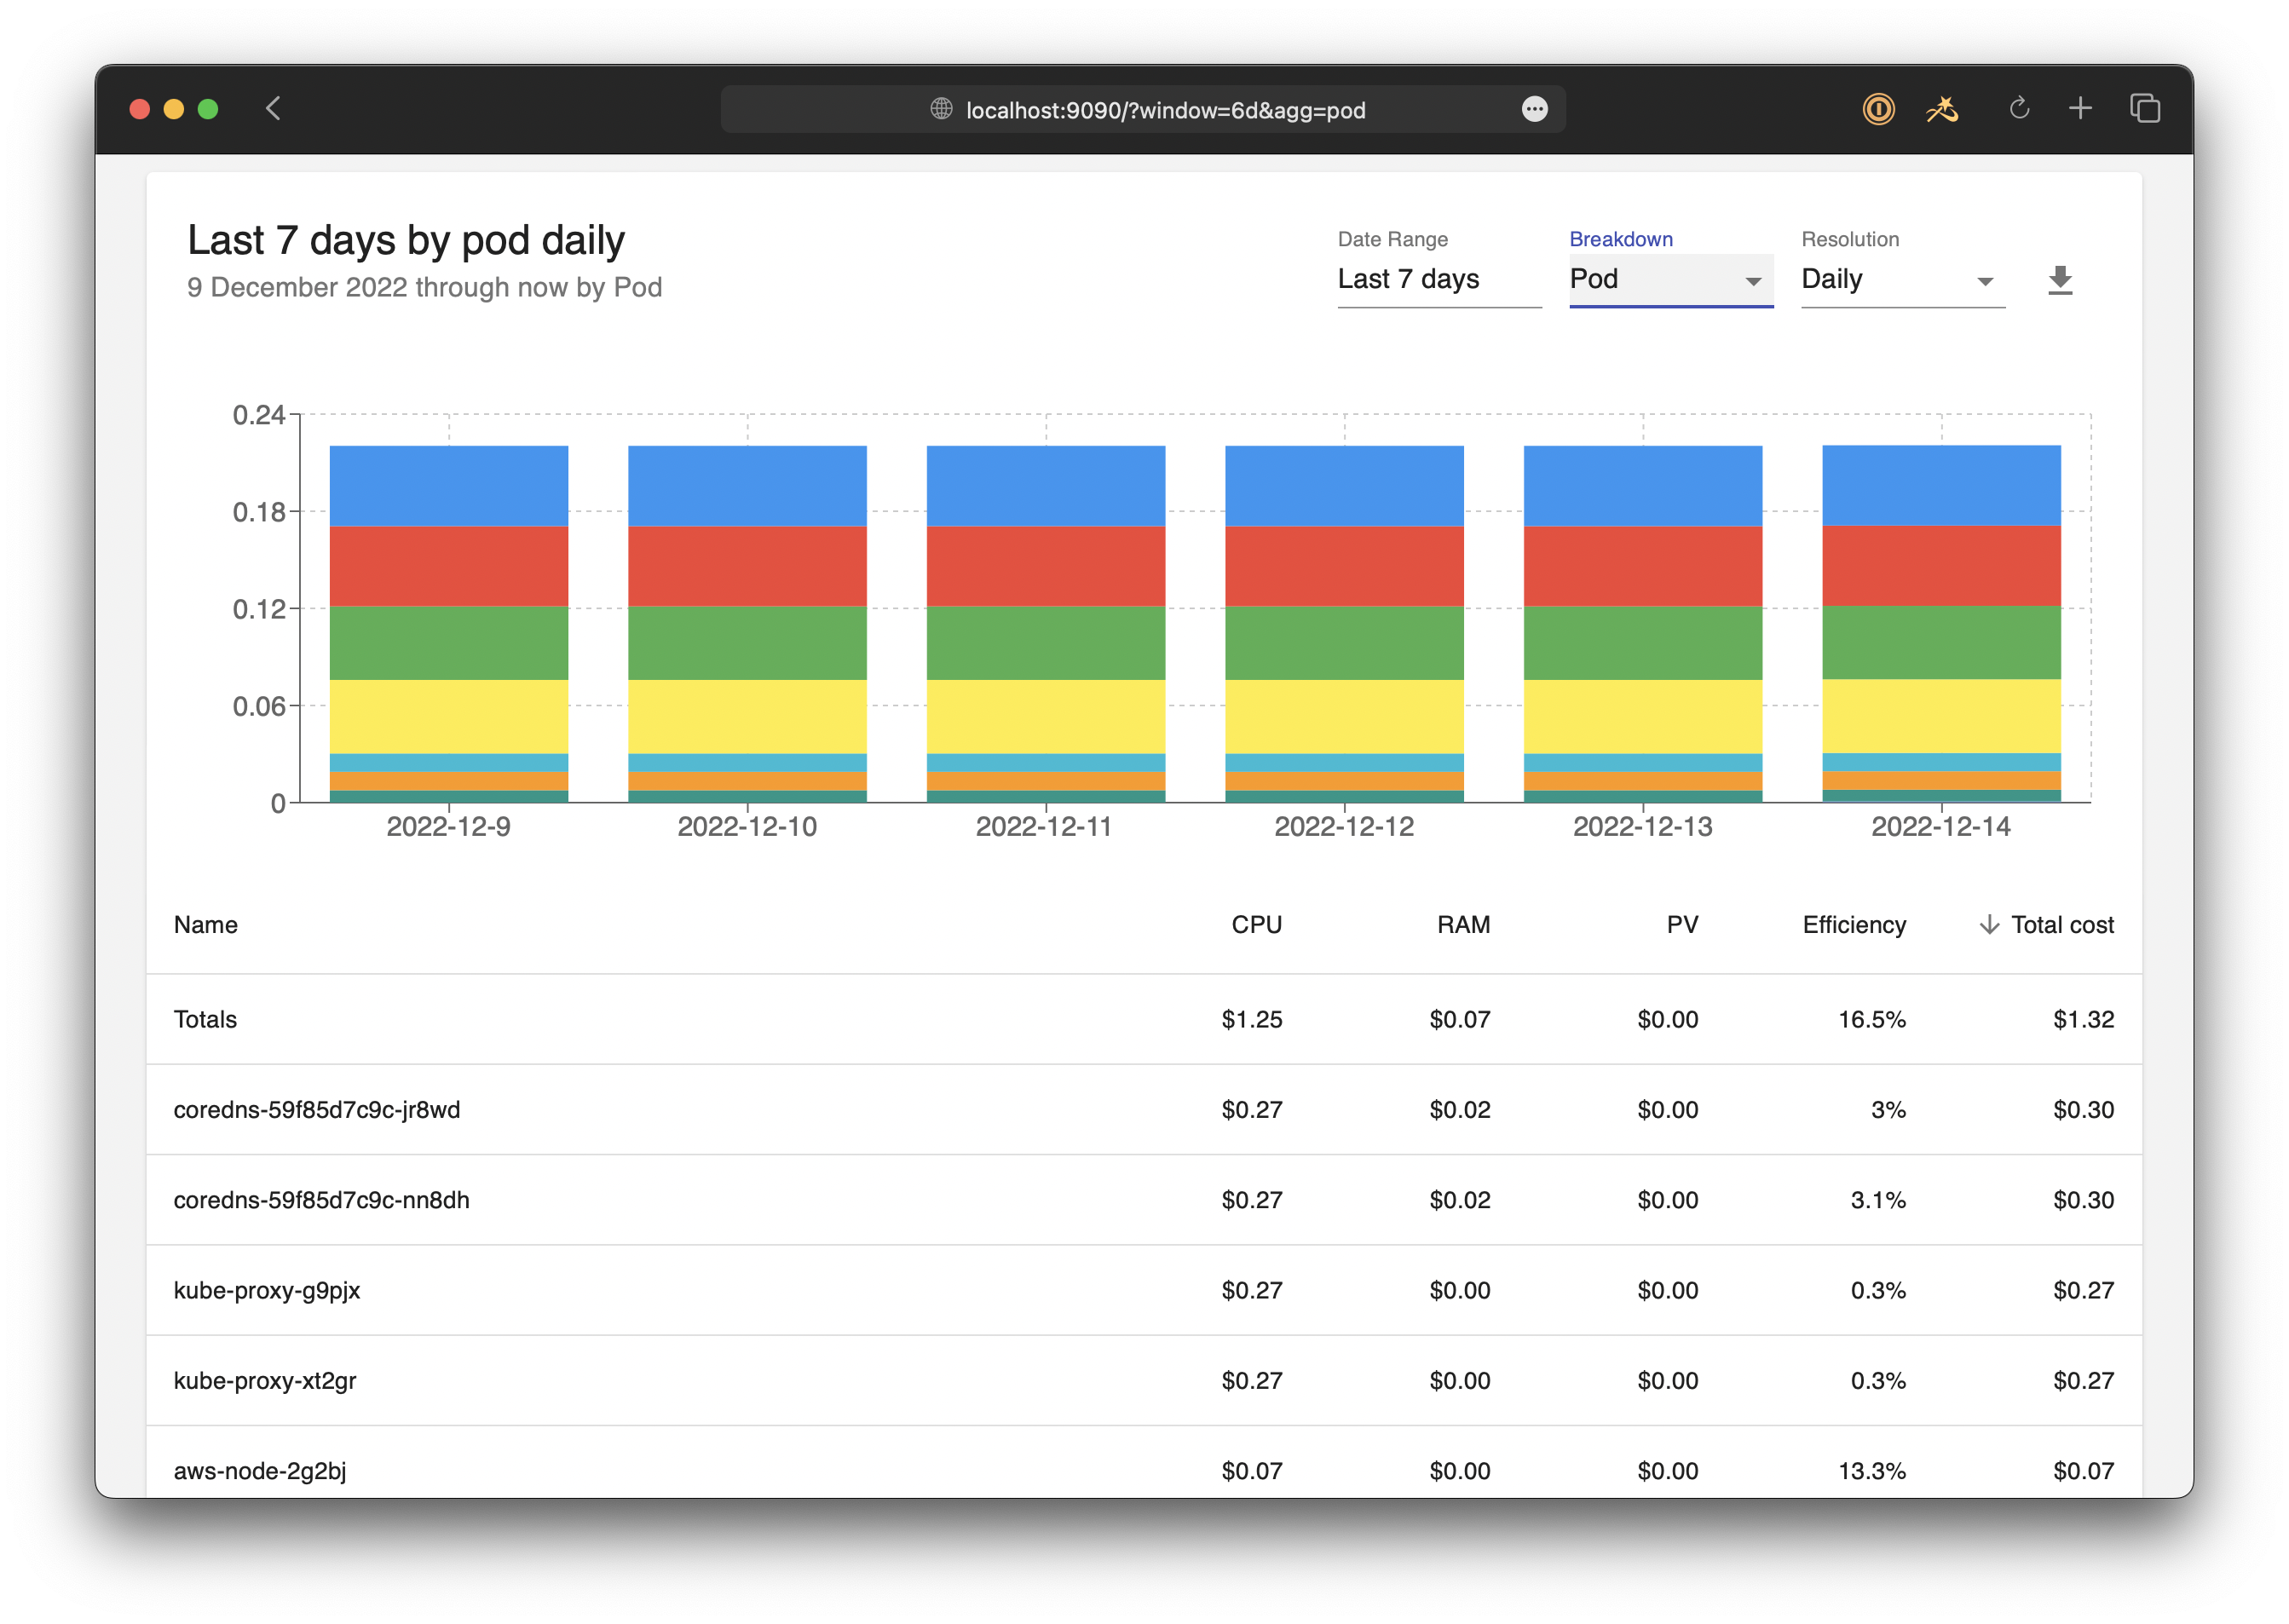
Kubecost is a Kubernetes cost monitoring and optimization platform that provides real-time visibility into cloud infrastructure spending across Kubernetes environments. Originally developed as an open source project and now offered by IBM, Kubecost helps organizations understand how resources are consumed across clusters, namespaces, workloads, and teams. The platform combines cost allocation, optimization insights, governance controls, and multi-cloud support.
Key features include:
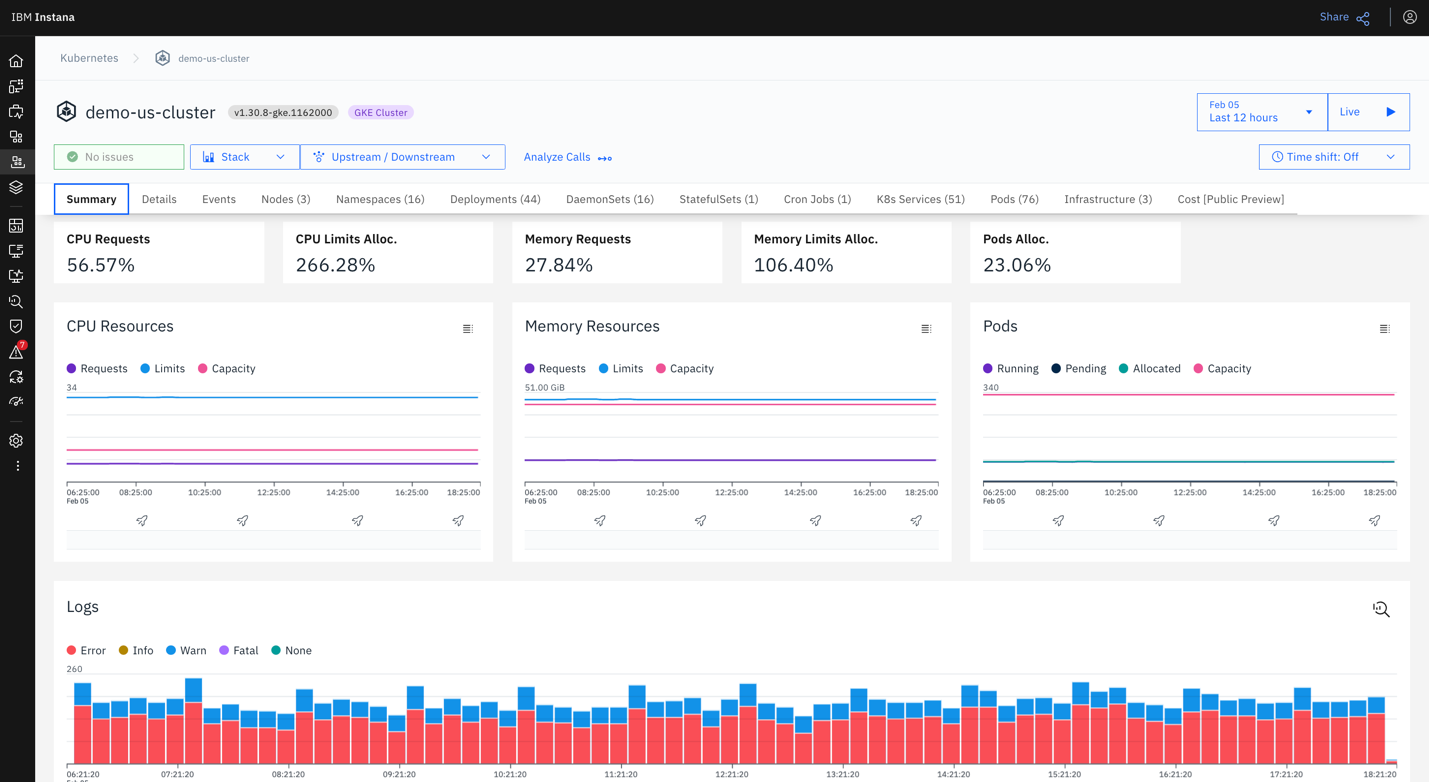
Source: Kubecost
CloudZero is a cloud cost intelligence platform that provides Kubernetes cost visibility and allocation across clusters, namespaces, labels, and pods. The platform helps organizations allocate Kubernetes spending, even in environments with inconsistent or incomplete labeling practices. By combining Kubernetes cost data with the rest of an organization’s cloud spending, CloudZero enables engineering, finance, and FinOps teams to analyze infrastructure costs.
Key features include:
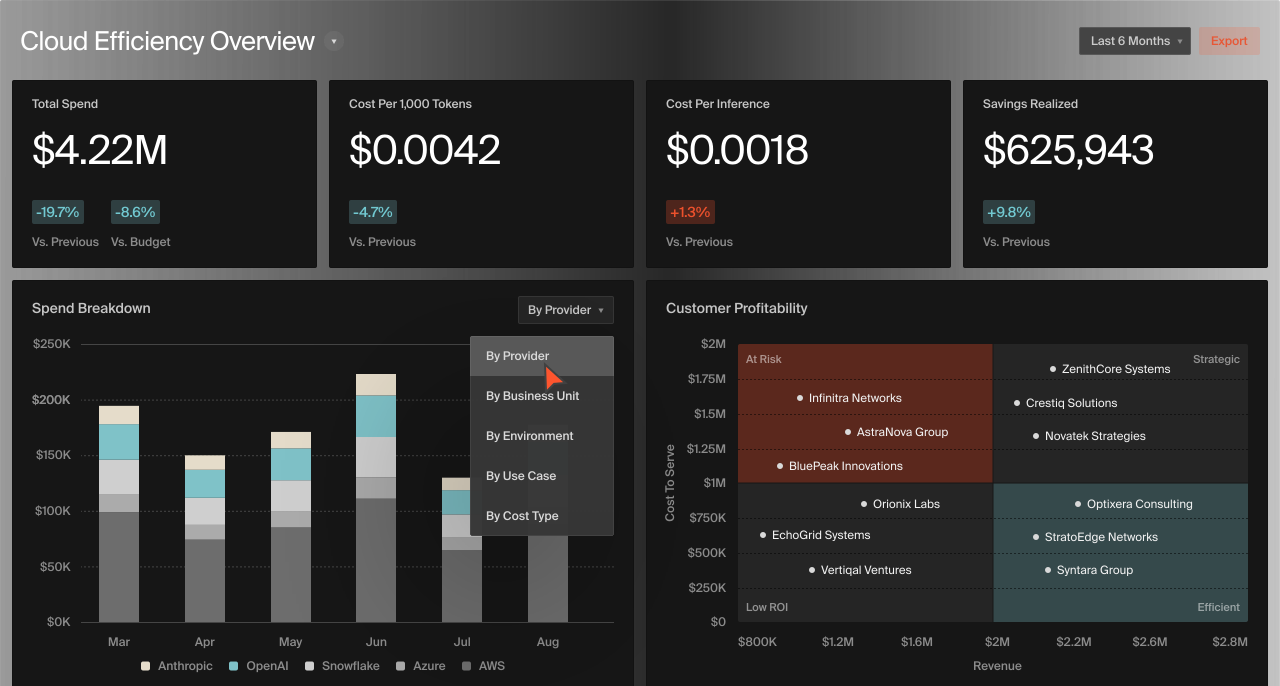
Source: CloudZero
Related content: Read our guide to Kubernetes cost management (coming soon)
Labels are one of the most important building blocks for Kubernetes cost monitoring. Since Kubernetes workloads are distributed dynamically across shared infrastructure, organizations need a reliable way to associate resource usage with teams, applications, environments, and business units. Without consistent labeling, cost reports become incomplete or inaccurate, making it difficult to understand who is responsible for infrastructure spending.
A standardized labeling strategy should be applied across Kubernetes resources, including namespaces, deployments, pods, services, and persistent volumes. Common labels include application name, team owner, environment, project, and cost center. These labels allow cost monitoring platforms to group spending data logically and generate reports that support budgeting, showback, and chargeback processes.
Consistency is critical because Kubernetes environments change constantly. Manual labeling often leads to missing or inconsistent metadata, especially in large organizations with multiple teams and deployment pipelines. Many companies enforce labeling standards using policy engines such as Kyverno or Open Policy Agent (OPA), which validate workloads before deployment. CI/CD pipelines can also verify required labels automatically, helping maintain accurate cost allocation and reporting across clusters.
Set Budget Alerts and Anomaly Detection
Kubernetes infrastructure can scale rapidly, which means cloud spending can increase unexpectedly if workloads are misconfigured or traffic spikes occur. Budget alerts and anomaly detection help organizations identify abnormal spending patterns early, before they significantly impact cloud bills. These controls are especially important in Kubernetes because workloads are dynamic and resource usage can change within minutes.
Budget alerts should be configured at multiple levels, including clusters, namespaces, teams, and applications. This provides more precise visibility than monitoring overall cloud spending alone. For example, an alert triggered by a sudden increase in a development namespace may reveal a failed batch job, an autoscaling issue, or a test environment left running accidentally.
Anomaly detection tools identify unusual patterns using historical cost and utilization data. These systems can detect behaviors such as runaway autoscaling, excessive network traffic, abnormal GPU usage, or workloads consuming resources continuously due to deployment errors. Integrating alerts into communication and incident management tools such as Slack, Microsoft Teams, or PagerDuty ensures that responsible teams are notified quickly, reducing response times and unnecessary infrastructure spending.
Kubernetes cost monitoring becomes more effective when integrated into broader FinOps workflows. FinOps focuses on collaboration between engineering, operations, and finance teams so organizations can manage cloud spending while maintaining performance and reliability. Kubernetes environments generate granular infrastructure data, and integrating this data into FinOps processes helps organizations make informed financial and operational decisions.
Engineering teams use Kubernetes cost data to optimize workloads, improve autoscaling policies, and reduce overprovisioning. Finance and FinOps teams use the same data for budgeting, forecasting, and tracking infrastructure trends. Shared visibility is important because cloud spending decisions increasingly happen at the engineering level, where deployment configurations and architecture choices directly affect infrastructure costs.
Organizations should establish recurring cost review processes that include workload-level reporting, trend analysis, and optimization tracking. Many companies implement showback or chargeback models to improve accountability across teams and business units. Cost monitoring platforms support these workflows by allocating infrastructure costs using Kubernetes metadata such as namespaces, labels, and clusters.
Autoscaling is important for Kubernetes efficiency, but poorly configured autoscaling policies can create unnecessary costs. Kubernetes automatically scales workloads and infrastructure based on resource demand, yet inaccurate scaling thresholds, oversized resource requests, and inefficient node configurations often lead to overprovisioning and idle capacity. Cost monitoring helps organizations determine whether autoscaling behavior aligns with actual workload usage.
Horizontal pod autoscaler (HPA), vertical pod autoscaler (VPA), and cluster autoscaler configurations should be reviewed regularly using historical utilization data. If workloads request more CPU or memory than needed, autoscalers may provision additional pods or nodes unnecessarily. This increases infrastructure spending without improving application performance. Monitoring the relationship between requested and actual usage helps teams tune autoscaling settings.
Organizations should also optimize scale-down behavior, replica minimums, and node pool strategies. Slow scale-down settings can leave cloud instances running after demand decreases, while excessive minimum replicas increase idle resource costs. Segmenting workloads into separate node pools optimized for specific resource patterns can improve bin packing efficiency and reduce wasted capacity. Continuous monitoring is important because workload behavior changes over time as applications evolve and traffic patterns shift.
Rightsizing is the process of adjusting Kubernetes resource requests and limits so they reflect actual workload requirements. Since Kubernetes scheduling decisions depend on resource requests, inaccurate sizing directly affects infrastructure utilization and cloud spending. Overprovisioned workloads reduce node density and increase the number of cloud instances required to run applications.
Many organizations approach rightsizing as a periodic optimization project, but Kubernetes environments are too dynamic for one-time reviews to remain effective. Application updates, changing traffic patterns, and scaling events continuously alter workload behavior. Continuous rightsizing allows teams to adapt resource allocations as usage patterns evolve and maintain efficient infrastructure utilization.
Effective rightsizing requires ongoing monitoring of CPU and memory requests compared to real consumption. Historical utilization data helps identify workloads that consistently reserve more resources than they use, while real-time monitoring reveals temporary spikes and shifting demand patterns. Many Kubernetes cost optimization platforms provide automated recommendations or dynamic adjustments based on observed usage. Organizations should validate changes carefully for production systems to ensure that cost reductions do not negatively affect reliability or application performance.
Kubernetes cost monitoring is essential for managing cloud spending, especially given the complexity of shared infrastructure and dynamic workloads. Achieving granular visibility requires tracking key metrics from the cluster down to the workload level. By implementing best practices such as consistent labeling and continuous rightsizing, organizations can overcome these challenges, ensuring resources are optimized for both performance and budget.