
PerfectScale
kubectl debug: A Complete Guide to Troubleshooting Pods & Nodes
kubectl debug is a built-in command used to troubleshoot running workloads in a Kubernetes cluster. It is used when you need to inspect a container that lacks essential debugging tools like a shell or network utilities (common in minimal \"distroless\" images) or when a pod is stuck in a crash loop.
This page is also available in Deutsch, Español, Français, Italiano, 日本語, and Português.


About Josh Palmer
Head of Content
I'm Josh Palmer, Head of Content at DoiT, where I split my time across multiple business units including DoiT Cloud Intelligence, PerfectScale (Kubernetes cost optimization), and SELECT (Snowflake, Databricks, and BigQuery cost optimization). Before DoiT, I spent four and a half years at OnBoard building content for a board intelligence platform used by 6,000+ organizations, and before that, two years as Content Marketing Manager at Zylo, a SaaS management platform.
My personal pageTL;DR
kubectl debugis kubectl's built-in interactive troubleshooting command. It works three ways: adding an ephemeral container to a running pod, creating a copy of a pod with modified settings, or spinning up a privileged-capable pod on a node.- Use it when
kubectl logsandkubectl describearen't enough — for example, a distroless container with no shell, or a pod stuck inCrashLoopBackOff. - Basic syntax:
kubectl debug (POD | TYPE/NAME) [flags], most commonlykubectl debug my-pod -it --image=busybox. - Debug sessions run under a debugging profile (
--profile, defaultgeneralas of current kubectl releases) that controls what capabilities and namespaces the debug container gets — it does not run privileged by default. - Best practice: start with logs/describe/events, use ephemeral containers only to inspect (never to patch a running workload), and clean up any pod created with
--copy-towhen you're done.
What Is kubectl debug?
kubectl debug is a built-in command used to troubleshoot running workloads in a Kubernetes cluster. It is primarily used when you need to inspect a container that lacks essential debugging tools like a shell or network utilities (common in minimal "distroless" images) or when a pod is stuck in a crash loop.
Common commands:
For detailed syntax, refer to the official Kubernetes kubectl debug documentation.
| Scenario | Command example |
|---|---|
| Add shell to running pod | kubectl debug -it <pod-name> --image=busybox |
| Share process namespace | kubectl debug -it <pod-name> --image=busybox --target=<container-name> |
| Debug a crashing pod | kubectl debug <pod-name> -it --copy-to=debug-pod --image=ubuntu -- /bin/bash |
| Debug a cluster node | kubectl debug node/<node-name> -it --image=ubuntu |
Key flags:
-i/-t(commonly combined as-it): Attaches an interactive TTY to the new container's console immediately.--target: Specifies a container in the pod to share its process namespace with, allowing you to see its running processes with tools likeps.--copy-to: Names a new pod that will be created as a copy of the original for troubleshooting.--profile: Selects the debugging profile (general,baseline,restricted,netadmin, orsysadmin) that controls the security context and namespaces given to the debug container. Defaults togeneralon current kubectl releases.
Use Cases for kubectl debug
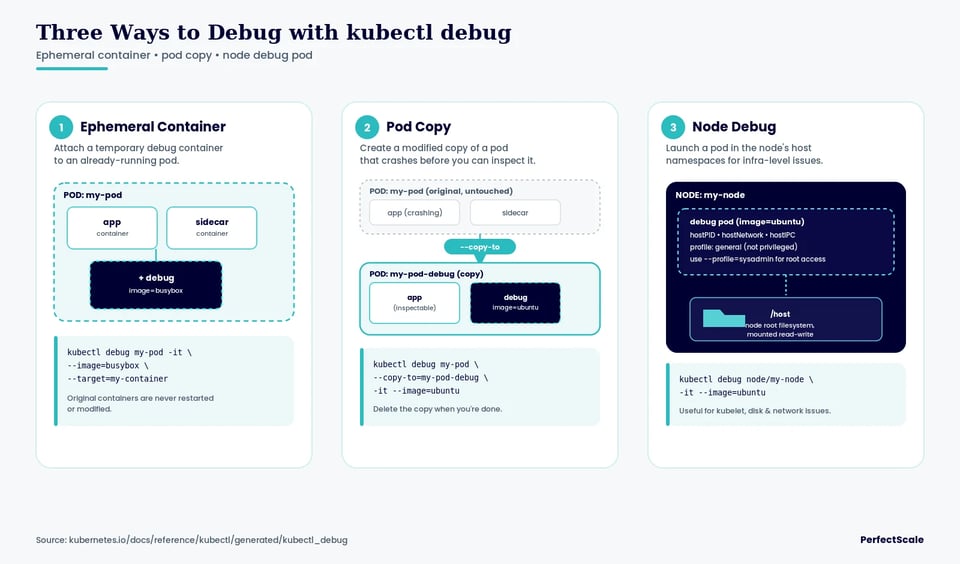
The command operates in three primary ways depending on the target resource:
- Ephemeral containers: Adds a temporary container with your choice of image (e.g.,
busyboxorubuntu) to an existing, running pod. This allows you to run diagnostics without restarting the pod. - Pod copying: Creates a copy of a pod with modified attributes, such as a different container image or command. This is useful for troubleshooting pods that crash on startup and cannot be accessed while running.
- Node debugging: Creates a new pod that runs in the node's host namespaces and mounts the node's root filesystem. This is used for infrastructure-level troubleshooting directly on a cluster node.
The kubectl debug Syntax
The kubectl debug command supports several debugging workflows, including adding ephemeral containers to pods, creating copies of pods for troubleshooting, and debugging nodes.
kubectl debug (POD | TYPE/NAME) [flags]The most common flag options include:
| Option | Description |
|---|---|
-it |
Starts an interactive terminal session |
--image |
Specifies the container image to use for debugging |
--target |
Targets a specific container inside a pod |
--copy-to |
Creates a copy of a pod for debugging |
--share-processes |
Enables process namespace sharing in copied pods |
--profile |
Selects the debugging profile (general by default) that sets the debug container's security context and namespaces |
node/NODE_NAME |
Starts a debugging session for a node |
Common Commands of kubectl debug
1. Add shell to running pod
This example adds an ephemeral container with a shell to an existing pod. The debug container runs alongside the original containers without modifying them.
kubectl debug my-pod -it --image=busyboxIf the pod contains multiple containers, you can target a specific container:
kubectl debug my-pod -it --image=busybox --target=my-containerThe --target flag shares the process namespace with the named container, so the debug container can see (and interact with) its running processes.
2. Share Process Namespace
By default, ephemeral containers may not see processes running in other containers. The --share-processes flag enables process namespace sharing in a copied pod, allowing you to inspect running processes across containers.
kubectl debug my-pod --copy-to=my-pod-debug --share-processes -it --image=busyboxThis is useful for tools such as ps, top, or strace when investigating process-level issues.
3. Debug a Crashing Pod
When a container crashes repeatedly, it may terminate before you can inspect it. The --copy-to option creates a copy of the pod with modified settings for troubleshooting.
kubectl debug my-pod --copy-to=my-pod-debug -it --image=ubuntuYou can then inspect mounted volumes, environment variables, configuration files, or application binaries without affecting the original pod.
4. Debug a Cluster Node
kubectl debug can also create a temporary pod attached to a node for node-level troubleshooting. This is useful when investigating kubelet issues, networking problems, or disk usage.
kubectl debug node/my-node -it --image=ubuntuBy default, node debugging uses the general profile: the debug pod runs in the node's host namespaces (hostPID, hostNetwork, hostIPC) and mounts the node's root filesystem at /host, but it does not run with a privileged security context. From there, you can inspect the host filesystem and system services. If you need full root-level (privileged) access on the node — for example, to load kernel modules or use raw sockets — request it explicitly with --profile=sysadmin.
kubectl debug vs. kubectl logs vs. kubectl describe
kubectl debug, kubectl logs, and kubectl describe are all troubleshooting commands, but they serve different purposes. kubectl logs retrieves application output, kubectl describe shows Kubernetes resource details and events, and kubectl debug provides interactive access for live investigation.
| Command | Primary Purpose | Typical Use Case |
|---|---|---|
kubectl logs |
View container logs | Check application output and error messages |
kubectl describe |
Inspect resource state and events | Diagnose scheduling, configuration, or lifecycle issues |
kubectl debug |
Perform interactive debugging | Investigate running containers, nodes, or networking problems |
kubectl logs
The kubectl logs command displays stdout and stderr output from containers. It is commonly used to identify application crashes, startup failures, or runtime errors.
kubectl logs my-podFor multi-container pods, specify the container name:
kubectl logs my-pod -c app-containerThis command is lightweight and safe because it does not modify the pod or create new containers.
kubectl describe
The kubectl describe command provides detailed information about Kubernetes resources, including labels, conditions, mounted volumes, and recent events.
kubectl describe pod my-podThis command is useful for diagnosing issues such as:
- Failed scheduling
- Image pull errors
- Probe failures
- Resource constraints
- CrashLoopBackOff events
Unlike kubectl logs, it focuses on Kubernetes object state rather than application output.
kubectl debug
The kubectl debug command enables interactive troubleshooting by attaching ephemeral containers or creating temporary debug pods.
kubectl debug my-pod -it --image=busyboxThis approach is useful when logs and resource descriptions are not enough. For example, you can:
- Inspect network connectivity
- Examine filesystem contents
- Run process inspection tools
- Debug minimal containers without shells
- Investigate node-level problems
Because it creates temporary debugging environments, kubectl debug provides deeper access than the other commands while minimizing changes to production workloads.
Practical kubectl debug Examples
Debug Network Connectivity
Use a debug container to test DNS, service discovery, and outbound network access from the pod's network namespace.
kubectl debug my-pod -it --image=busybox --target=my-containerInside the debug container, run commands such as:
nslookup kubernetes.defaultwget -qO- http://my-service.default.svc.cluster.localping 10.0.0.10This is useful when the application image does not include tools like nslookup, curl, or ping.
Debug a CrashLoopBackOff Pod
For a pod that keeps restarting, create a copy for inspection. This avoids changing the original workload.
kubectl debug my-pod --copy-to=my-pod-debug -it --image=ubuntuYou can inspect environment variables, mounted files, configuration, and network access from the copied pod:
envls -la /etc/configcat /etc/config/app.confThis helps identify missing files, bad environment values, or runtime dependencies.
Debug with Process Namespace Sharing
Use process namespace sharing when you need to inspect processes from another container in the pod.
kubectl debug my-pod \ --copy-to=my-pod-debug \ --share-processes \ -it \ --image=ubuntuInside the debug container, check running processes:
ps auxtopThis is useful for inspecting stuck processes, zombie processes, or unexpected child processes.
Debug Using a Custom Image
Use a custom debug image when standard images do not include the tools you need.
kubectl debug my-pod -it \ --image=my-registry.example.com/debug-tools:latest \ --target=my-containerA custom image can include tools such as curl, dig, tcpdump, strace, or database clients. This keeps production images small while still allowing deeper troubleshooting when needed.
Best Practices for Using kubectl debug
Here are some useful practices to consider when using this command.
1. Start with Observability Before Entering the Pod
Use kubectl logs, kubectl describe, events, metrics, and traces before starting an interactive debug session. These tools are faster, safer, and often enough to identify the problem.
kubectl logs my-podkubectl describe pod my-podkubectl get events --sort-by=.metadata.creationTimestampThis helps confirm whether the issue is caused by the application, scheduling, probes, resource limits, networking, or Kubernetes configuration. For example, kubectl describe can show image pull failures, failed readiness probes, or volume mount errors before you spend time inspecting the container directly.
Use kubectl debug when the available signals do not explain the issue, or when you need to inspect runtime state from inside the pod's environment.
2. Use Ephemeral Containers for Inspection, Not Application Changes
Ephemeral containers are intended for troubleshooting. Do not use them to patch files, restart services, install dependencies, or change application behavior in a running workload.
Use them to inspect state, run diagnostic commands, and collect evidence:
kubectl debug my-pod -it --image=busybox --target=my-containerFor example, you can check DNS resolution, inspect mounted files, test service connectivity, or view running processes. These actions help explain what is happening without changing the workload.
Any fix should be made in the source code, container image, manifests, or deployment pipeline. This keeps production behavior repeatable and prevents one-off manual changes that disappear after the pod restarts.
3. Prefer Debug Containers Over Adding Tools to Production Images
Avoid installing shells, package managers, and network tools in production images just for troubleshooting. These tools increase image size and may expand the attack surface of the container.
Instead, keep application images small and use a separate debug image when needed:
kubectl debug my-pod -it --image=nicolaka/netshoot --target=my-containerThis is especially useful for minimal images, such as distroless or scratch-based containers, which often do not include a shell. A debug container can provide tools like curl, dig, tcpdump, ss, and ip without changing the production image.
This approach also keeps the boundary clear: the application image runs the workload, while the debug image is used only during controlled troubleshooting sessions.
4. Use Approved, Secure Debugging Images
Debug images often include powerful tools such as tcpdump, strace, curl, dig, package managers, and shell utilities. Use only approved images from trusted registries.
Pin image versions instead of using floating tags:
kubectl debug my-pod -it --image=registry.example.com/debug-tools:1.4.2Approved images should be scanned for vulnerabilities and kept up to date. They should contain the tools your teams actually need, without unnecessary packages.
Access should also be controlled with RBAC. Not every user should be allowed to create ephemeral containers, attach to sensitive workloads, or start node-level debug sessions. Node debugging can expose host filesystems and system-level information, so it should be limited to trusted operators — pair this with the --profile flag (restricted or baseline) where possible to avoid granting more access than the session needs.
5. Clean Up Debug Pods and Document the Session
Remove copied debug pods after troubleshooting to avoid clutter and unnecessary resource usage.
kubectl delete pod my-pod-debugEphemeral containers added to existing pods cannot be removed from the pod spec, but they stop running when the debugging session ends. Copied pods, however, remain in the cluster until deleted.
Record what was checked, which commands were run, and what was found. This makes the incident easier to review and helps improve runbooks for future issues.
Good notes should include the affected pod or node, the debug image used, important command output, and the final cause. This helps other engineers avoid repeating the same investigation later.
Reduce Manual Debugging by Proactively Fixing Resilience Risks with PerfectScale
Commands like kubectl debug are essential when you need to investigate a crashing pod, a stuck process, or a node-level problem in real time, but most of those incidents trace back to resource misconfigurations that could have been caught earlier. PerfectScale autonomously boosts Kubernetes resilience and performance by right-sizing workloads, preventing downtime, and optimizing resource use for 99.99% availability, so your team spends less time opening interactive debug sessions and more time shipping. Instead of waiting for a pod to fail and then reaching for ephemeral containers, PerfectScale identifies and remediates the resiliency risks that cause those failures in the first place.
Key capabilities of PerfectScale:
- Automatic issue remediation: Instantly identifies and fixes resiliency risks to maximize uptime and eliminate latency, preventing configuration errors (no CPU request, no memory request, no memory limits) and resource under-provisioning issues such as OOM, CPU throttling, and eviction.
- Infrastructure hardening: Gives holistic visibility across your nodes to proactively surface misconfigurations, prevent node over-commitment with precise memory limit recommendations, validate node affinities and taints, and choose the most suitable node types for your pods.
- Impact-driven prioritization: Focuses your team on the most critical issues in real time with advanced auto-prioritization, and aligns alerting with your SLAs and SLOs so service levels stay on target.
- Real-time alerts and ticketing integrations: Sends instant notifications through Slack, MS Teams, or Datadog, and lets you escalate any issue into an established workflow by creating a ticket in one click.
- Broad risk coverage: Continuously detects evictions, out of memory, suspected memory leaks, CPU throttling, pod restarts, HPA hitting max replicas, and under-provisioned or unset CPU and memory requests and limits.
Learn more about how PerfectScale can keep your clusters stable and cut the need for manual troubleshooting on the Kubernetes performance optimization platform.
FAQ
What is the kubectl debug command used for?
kubectl debug is used to troubleshoot Kubernetes workloads and nodes interactively. It can attach an ephemeral container to a running pod, create a modified copy of a crashing pod, or launch a debug pod on a node — all without needing debugging tools already baked into the target image.
How do I use kubectl debug on a pod?
Run kubectl debug <pod-name> -it --image=busybox to attach an ephemeral debug container to a running pod. Add --target=<container-name> to share the process namespace with a specific container, or --copy-to=<new-pod-name> to debug a copy instead of the live pod (useful for pods that crash on startup).
How do I use kubectl debug on a node?
Run kubectl debug node/<node-name> -it --image=ubuntu to create a debug pod that runs in the node's host namespaces with the node's root filesystem mounted at /host. This defaults to the general profile, which does not grant privileged access — use --profile=sysadmin if you need full root-level capabilities.
What is the kubectl debug command syntax?
The general form is kubectl debug (POD | TYPE/NAME) [flags], most commonly used with --image to set the debug container's image, -it for an interactive terminal, --target to target a specific container, and --copy-to to debug a pod copy.
How is kubectl debug different from kubectl exec?
kubectl exec runs a command inside an existing container in the pod's own image, so it only works if that image already has the tools you need. kubectl debug attaches a separate container (or pod) with any image you choose, which is essential for minimal or distroless containers that have no shell at all.
Does kubectl debug modify the original pod or its containers?
Adding an ephemeral container with kubectl debug does not restart or modify the pod's existing containers — it only adds a temporary container alongside them. Using --copy-to goes further and creates a separate pod, leaving the original completely untouched.
Do I need to clean up pods created by kubectl debug?
Yes, for any pod created with --copy-to. Those pods persist in the cluster until you delete them with kubectl delete pod <debug-pod-name>. Ephemeral containers added directly to an existing pod don't need separate cleanup — they stop running when the session ends, though they remain listed in the pod spec.