With Prometheus Postgres Exporter as part of your monitoring toolkit, you have the power to gain deeper insights into the performance, health, and behavior of your PostgreSQL databases.
Monitoring is a crucial aspect of maintaining the health and performance of any application. Prometheus is an open-source monitoring and alerting system that helps you track the health and performance of your applications and services. Prometheus Operator is a Kubernetes-native application that simplifies the deployment and management of Prometheus instances. It allows you to define the configuration for your Prometheus instances as Kubernetes resources, which can be version controlled and easily deployed across multiple environments.
In this article, we will focus on setting up Prometheus monitoring for a PostgreSQL database that is running on Amazon Web Services (AWS) Relational Database Service (RDS). AWS RDS provides a managed database service that makes it easy to set up, operate, and scale a relational database in the cloud.
We will cover the steps necessary to configure Prometheus to collect metrics from PostgreSQL, including setting up the necessary exporters and configuring the Prometheus server to scrape those metrics. Additionally, we will discuss how to set up alerts based on those metrics using Prometheus alerting rules. Last, we will show you how to visualize the data in a Grafana dashboard, including a sample dashboard I built that you can easily import.
Monitoring PostgreSQL with Prometheus Operator
Install and configure Prometheus Postgres Exporter
Prometheus Postgres Exporter is a tool used for exporting PostgreSQL database metrics to Prometheus. It's an open-source software that is designed to help users monitor and measure the performance of their PostgreSQL database instances. The Prometheus Postgres Exporter collects metrics from PostgreSQL and provides a web endpoint for Prometheus to scrape. These metrics include database size, transaction rates, and query execution times. With this information, users can gain insight into the health and performance of their database, identify bottlenecks and optimize database performance.
Install and configure Prometheus Cloudwatch Exporter
Prometheus Cloudwatch Exporter is a tool that allows you to collect metrics from AWS CloudWatch and expose them to Prometheus for monitoring and alerting. It enables you to monitor your AWS infrastructure, including EC2 instances, RDS databases, and more, by exporting metrics in a Prometheus-compatible format.
Grafana
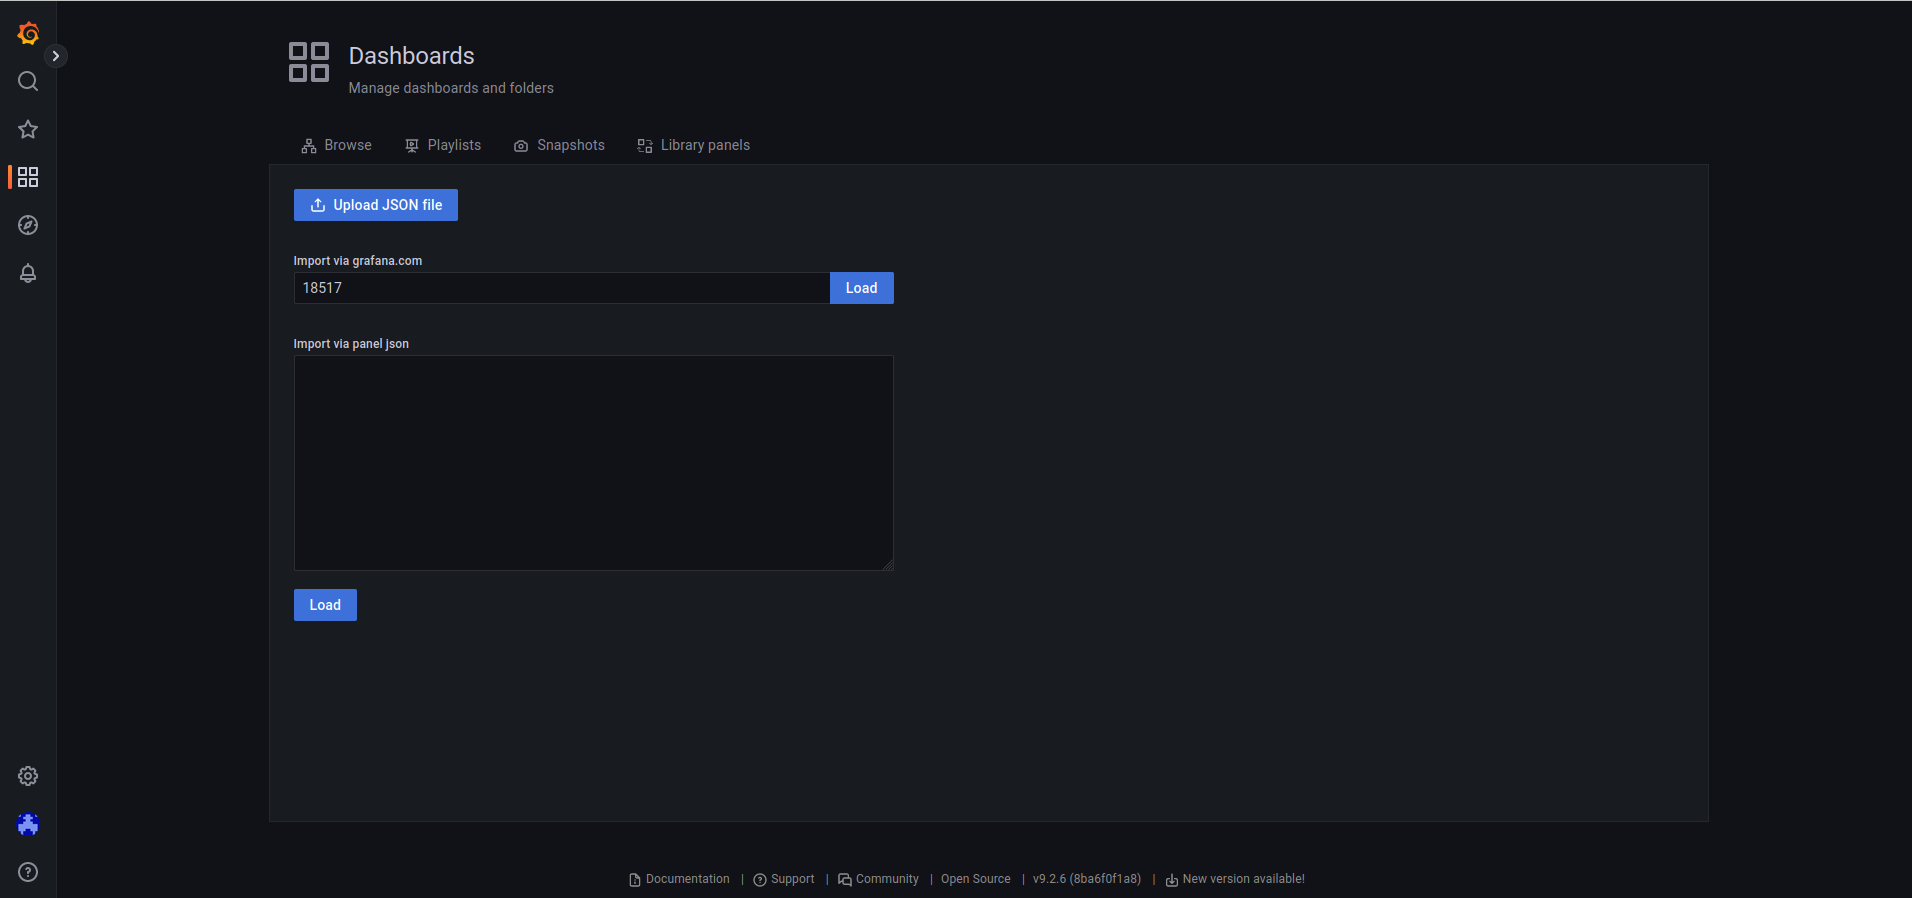
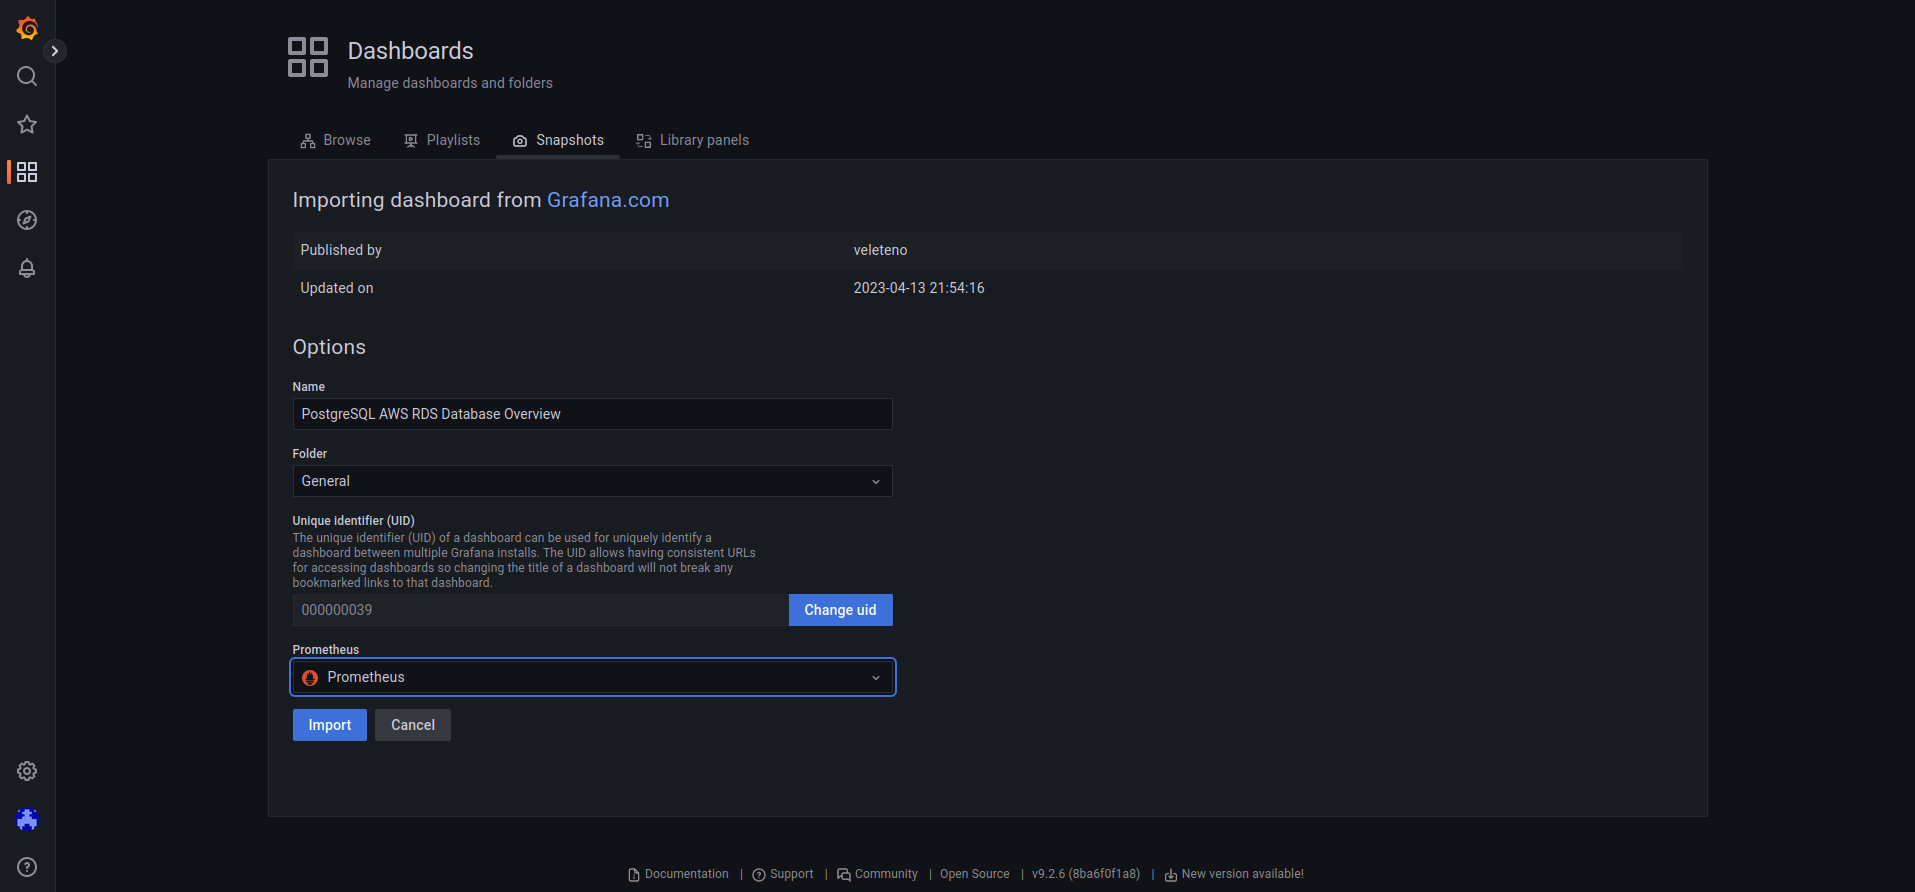
Import previously created dashboard based on the metrics above exporters to the Grafana.
By the end of this article, you will have a fully functioning Prometheus monitoring setup for your PostgreSQL database running on AWS RDS, allowing you to proactively monitor and troubleshoot any issues that may arise.
Prerequisites
Before we begin setting up monitoring, there are a few prerequisites that must be in place.
First, we need to have a working installation of Prometheus Operator and Grafana. We will be using Helm to install exporters which is a package manager for Kubernetes. If you haven't installed Helm already, you can follow the official documentation to do so.
Second, we need to have access to our PostgreSQL database running on AWS RDS. We will need the endpoint URL, port number, and login credentials to connect to the database.
Third, we need to have the appropriate IAM permissions to access the necessary resources in AWS. We will need to create an IAM user with the required permissions, generate an access key and secret access key, and store them securely.
Do not forget set resources, it is very important to set correct requests and limits. Tools like PerfectScale by DoiT can be used to identify the optimal request and limits:
Add PrometheusRules, I added 6 but if you need you can add more. The final dev.yaml file should look like this:
serviceMonitor:
  enabled: true
config:
  datasource:
    host: postgres.dev.mydoman.com
    user: postgresql
    password: postgresql
resources:
  limits:
    cpu: 100m
    memory: 256Mi
  requests:
    cpu: 50m
    memory: 128Mi
prometheusRule:
  enabled: true
additionalLabels:
release: prometheus
rules:
- alert: PostgreSQLMaxConnectionsReached
expr: sum by (server) (pg_stat_activity_count) >= sum by (server) (pg_settings_max_connections) - sum by (server) (pg_settings_superuser_reserved_connections)
for: 5m
labels:
severity: critical
annotations:
description: '{{ "{{ $labels.server }}" }} is exceeding the currently configured maximum Postgres connection limit (current value: {{ `{{ $value }}` }}). Services may be degraded - please take immediate action (you probably need to increase max_connections in the Docker image and re-deploy.'
summary: '{{ "{{ $labels.server }}" }} has maxed out Postgres connections.'
- alert: PostgreSQLHighConnections
expr: sum by (server) (pg_stat_activity_count) > (sum by (server) (pg_settings_max_connections) - sum by (server) (pg_settings_superuser_reserved_connections)) * 0.8
for: 5m
labels:
severity: warning
annotations:
description: '{{ "{{ $labels.server }}" }} is exceeding 80% of the currently configured maximum Postgres connection limit (current value: {{ `{{ $value }}` }}). Please check utilization graphs and confirm if this is normal service growth, abuse or an otherwise temporary condition or if new resources need to be provisioned (or the limits increased, which is mostly likely).'
summary: '{{ "{{ $labels.server }}" }} is over 80% of max Postgres connections.'
- alert: PostgreSQLDown
expr: pg_up != 1
for: 5m
labels:
severity: critical
annotations:
description: '{{ `{{ $labels.instance }}` }} is rejecting query requests from the exporter, and thus probably not allowing DNS requests to work either. User services should not be effected provided at least 1 node is still alive.'
summary: 'PostgreSQL is not processing queries: {{ `{{ $labels.instance }}` }}'
- alert: PostgreSQLSlowQueries
expr: |-
avg by (datname) (
rate (
pg_stat_activity_max_tx_duration{datname!~"template.*"}[2m]
)
) > 2 * 60
for: 2m
labels:
severity: warning
annotations:
description: 'PostgreSQL high number of slow queries for database {{ `{{ $labels.datname }}` }} with a value of {{ `{{ $value }}` }}'
summary: 'PostgreSQL high number of slow queries for database: {{ `{{ $labels.datname }}` }}'
- alert: PostgreSQLQPS
expr: |-
avg by (datname) (
irate(
pg_stat_database_xact_commit{datname!~"template.*"}[5m]
)
+
irate(
pg_stat_database_xact_rollback{datname!~"template.*"}[5m]
)
) > 10000
for: 5m
labels:
severity: warning
annotations:
description: 'PostgreSQL high number of queries per second for database {{ `{{ $labels.datname }}` }} with a value of {{ `{{ $value }}` }}'
summary: 'PostgreSQL high number of queries per second for database {{ `{{ $labels.datname }}` }}'
- alert: PostgreSQLCacheHitRatio
expr: |-
avg by (datname) (
rate(pg_stat_database_blks_hit{datname!~"template.*"}[5m])
/
(
rate(
pg_stat_database_blks_hit{datname!~"template.*"}[5m]
)
+
rate(
pg_stat_database_blks_read{datname!~"template.*"}[5m]
)
)
) ) < 0.98
for: 5m
labels:
severity: warning
annotations:
description: 'PostgreSQL low on cache hit rate for database {{`{{ $labels.datname }}`}} with a value of {{`{{ $value }}`}}'
summary: 'PostgreSQL low cache hit rate for database {{`{{ $labels.datname }}`}}'
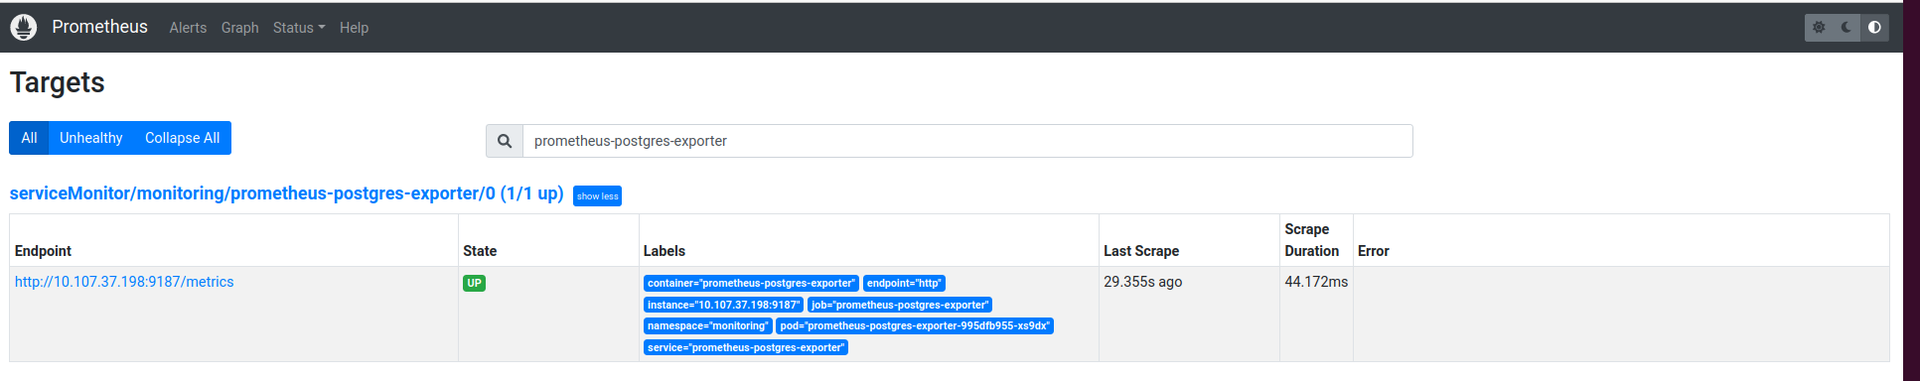
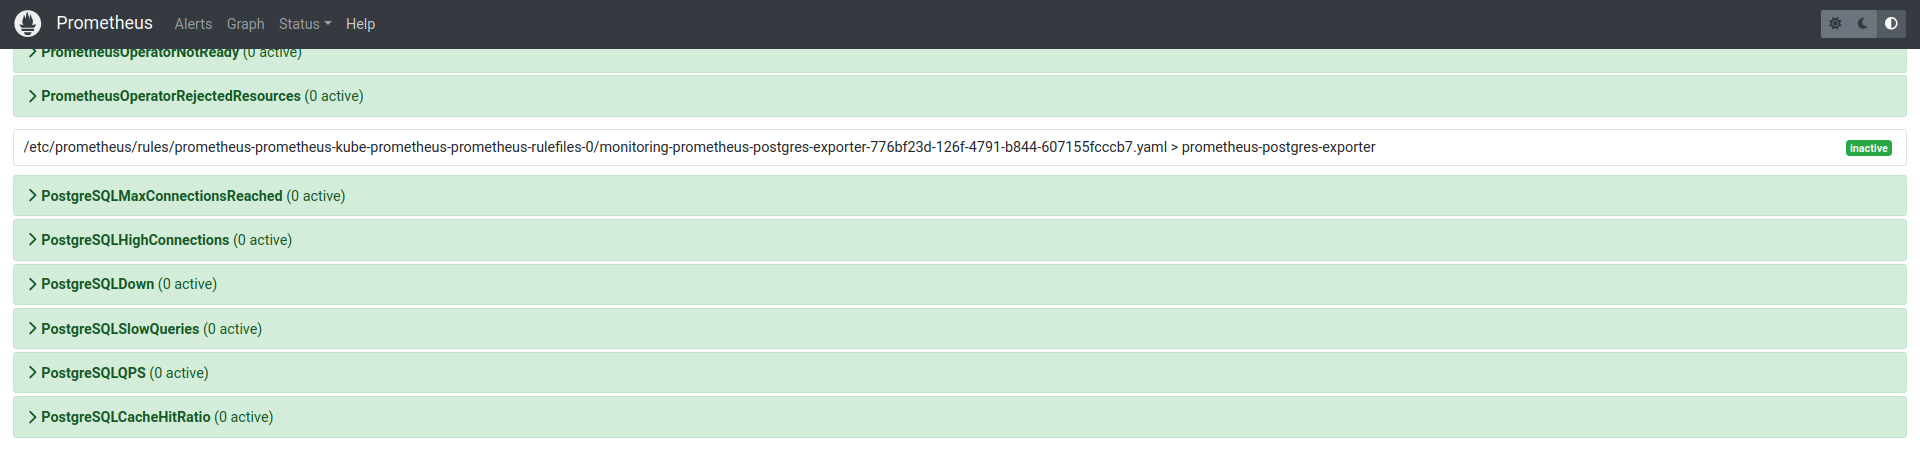
6. In few minutes you will see in the Prometheus additional target and alerts:
Prometheus
Prometheus
Prometheus CloudWatch Exporter
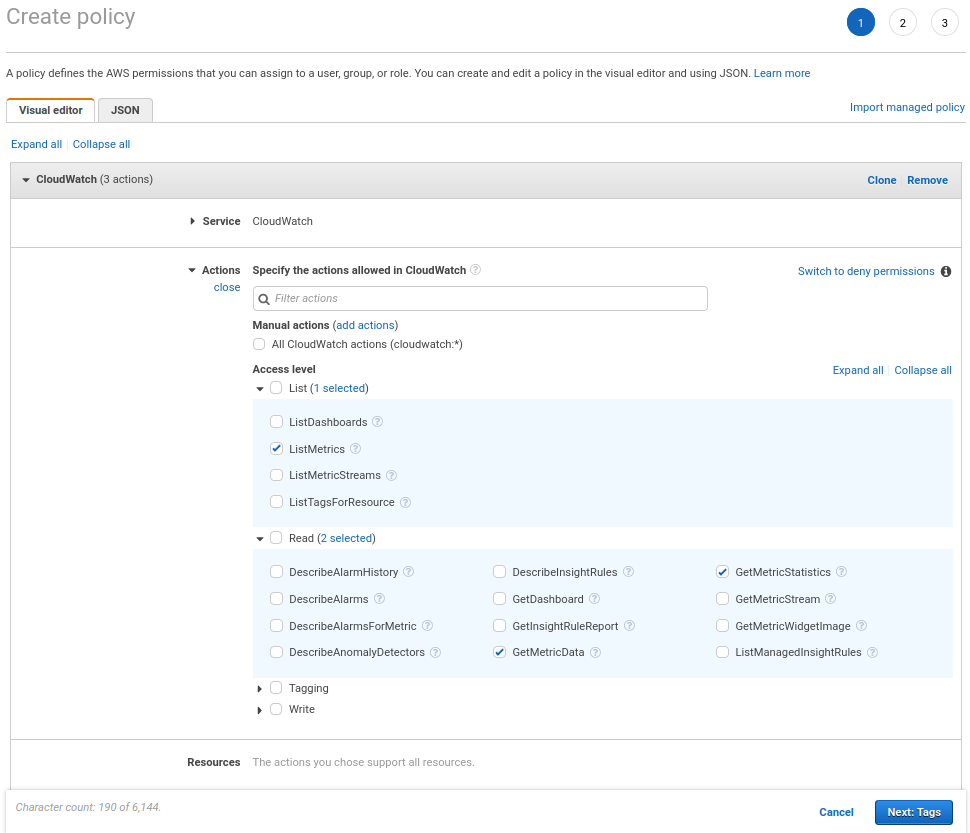
1. First we need create IAM user that can read CloudWatch metrics to get AWS_ACCESS_KEY_ID and AWS_SECRET_ACCESS_KEY. The cloudwatch:ListMetrics, cloudwatch:GetMetricStatistics and cloudwatch:GetMetricData IAM permissions are required.
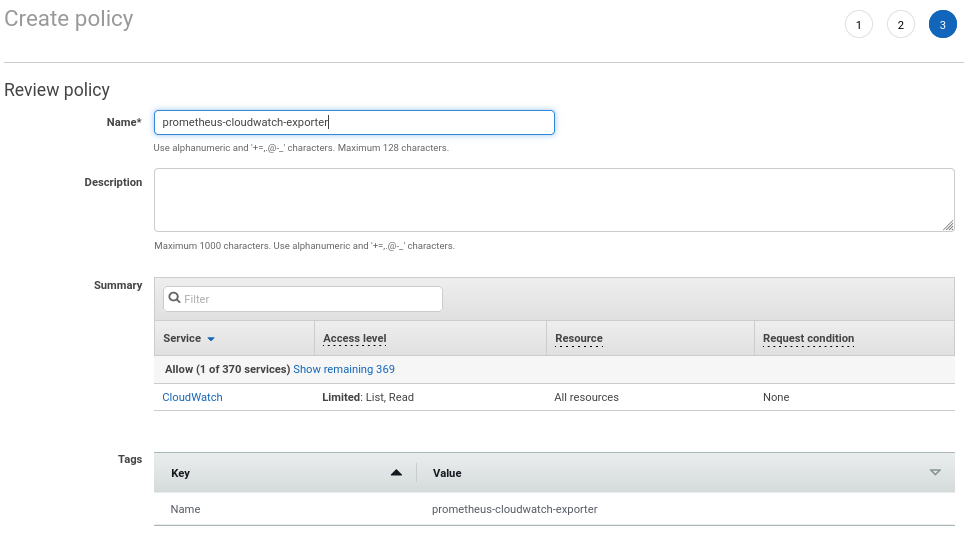
Create IAM policy “prometheus-cloudwatch-exporter” with the appropriate permissions:
Prometheus CloudWatch Exporter
Prometheus CloudWatch Exporter
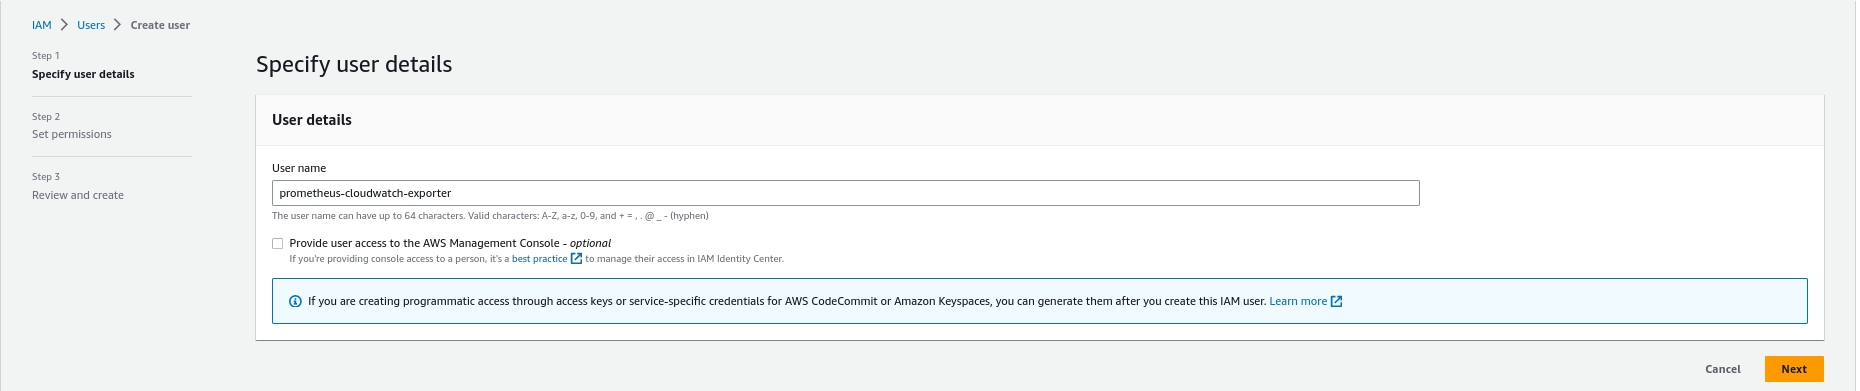
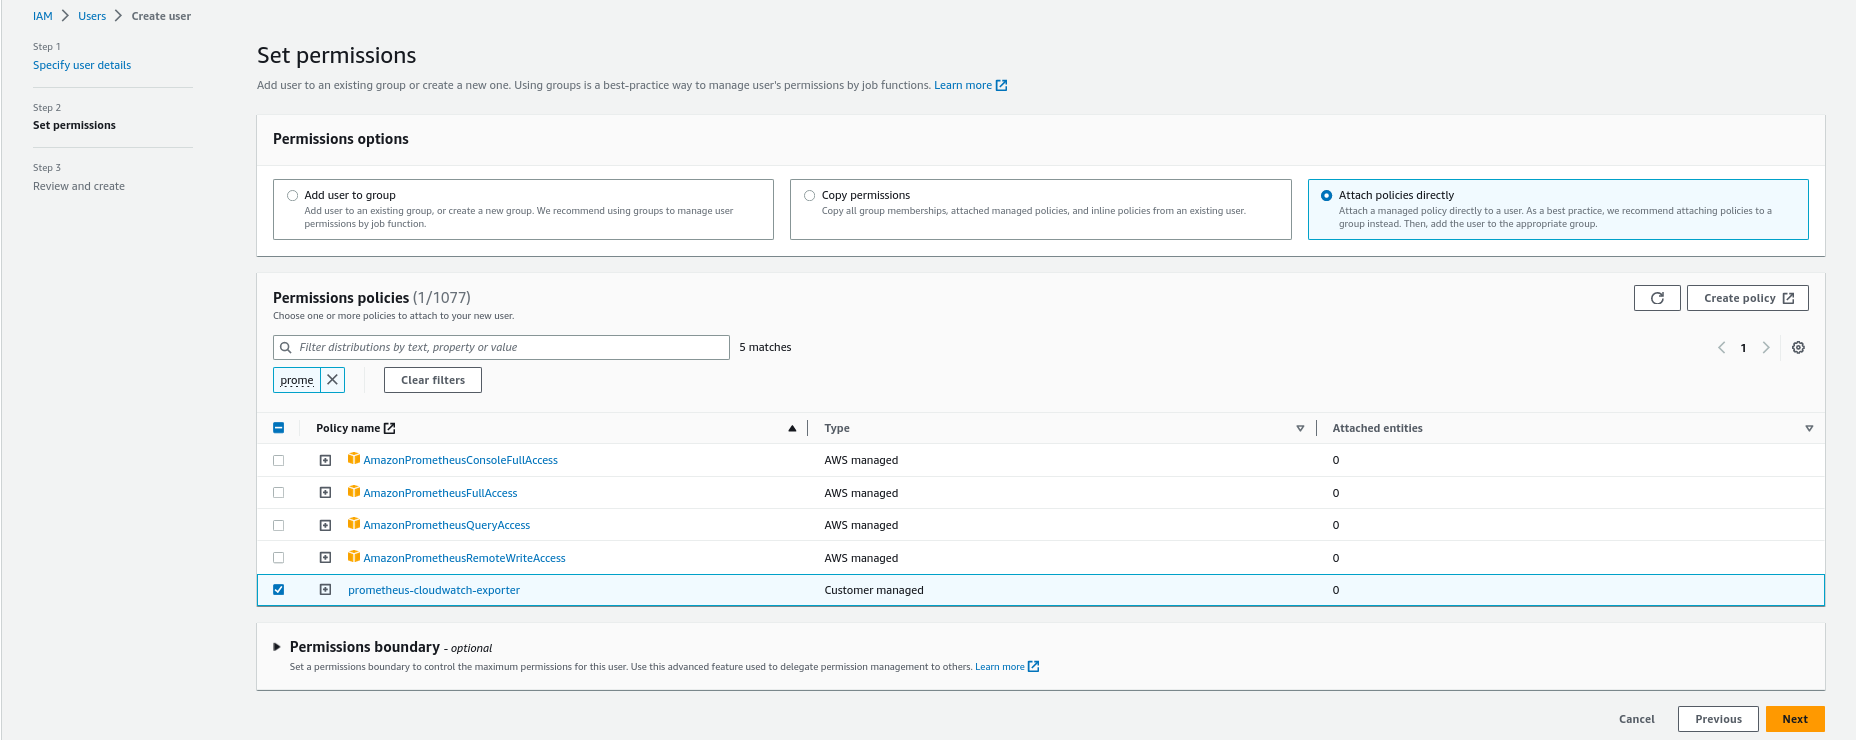
Create “prometheus-cloudwatch-exporter” IAM user and attach the policy:
Prometheus CloudWatch Exporter
Prometheus CloudWatch Exporter
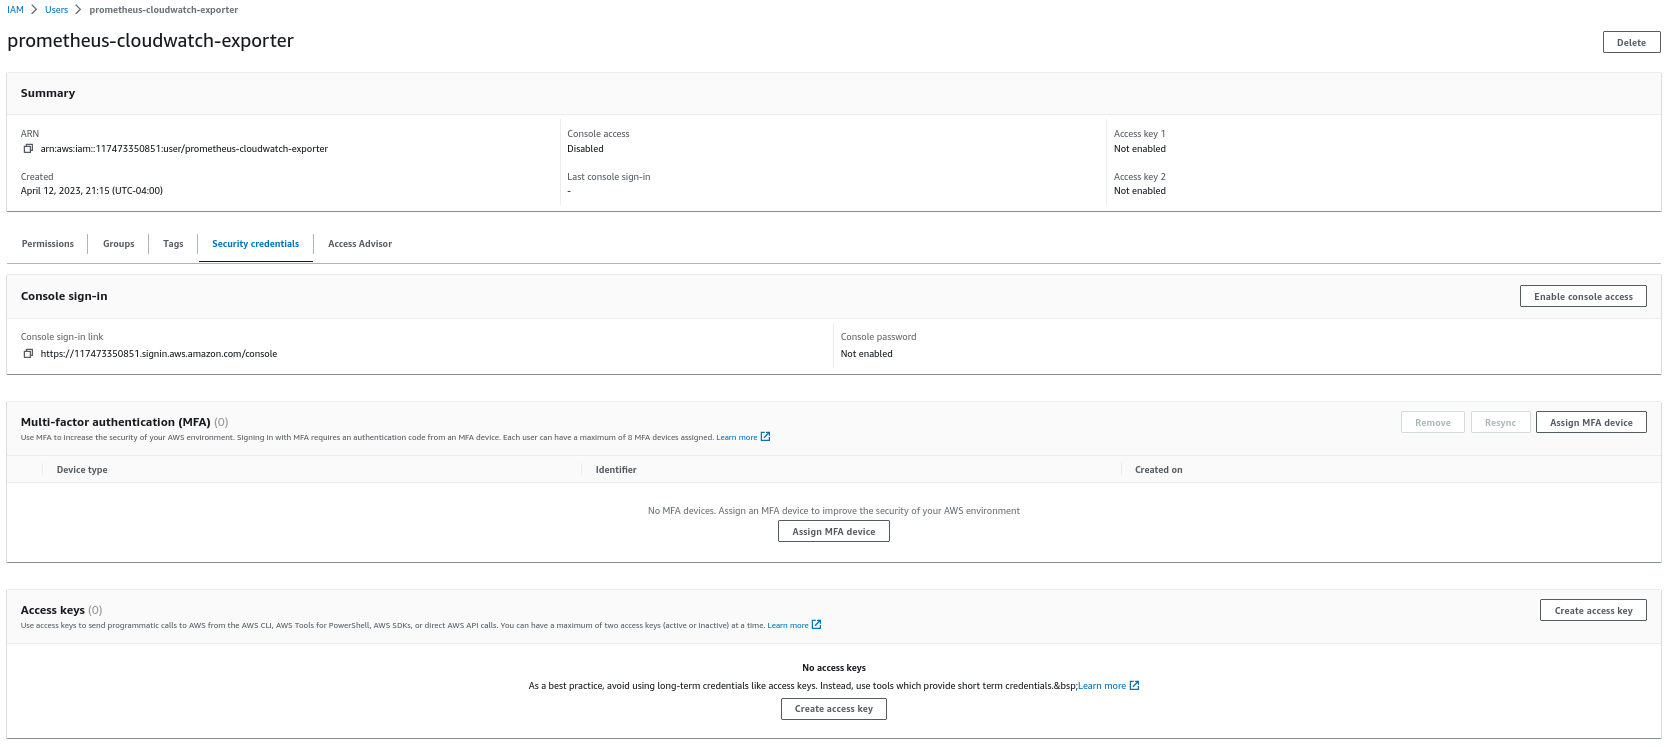
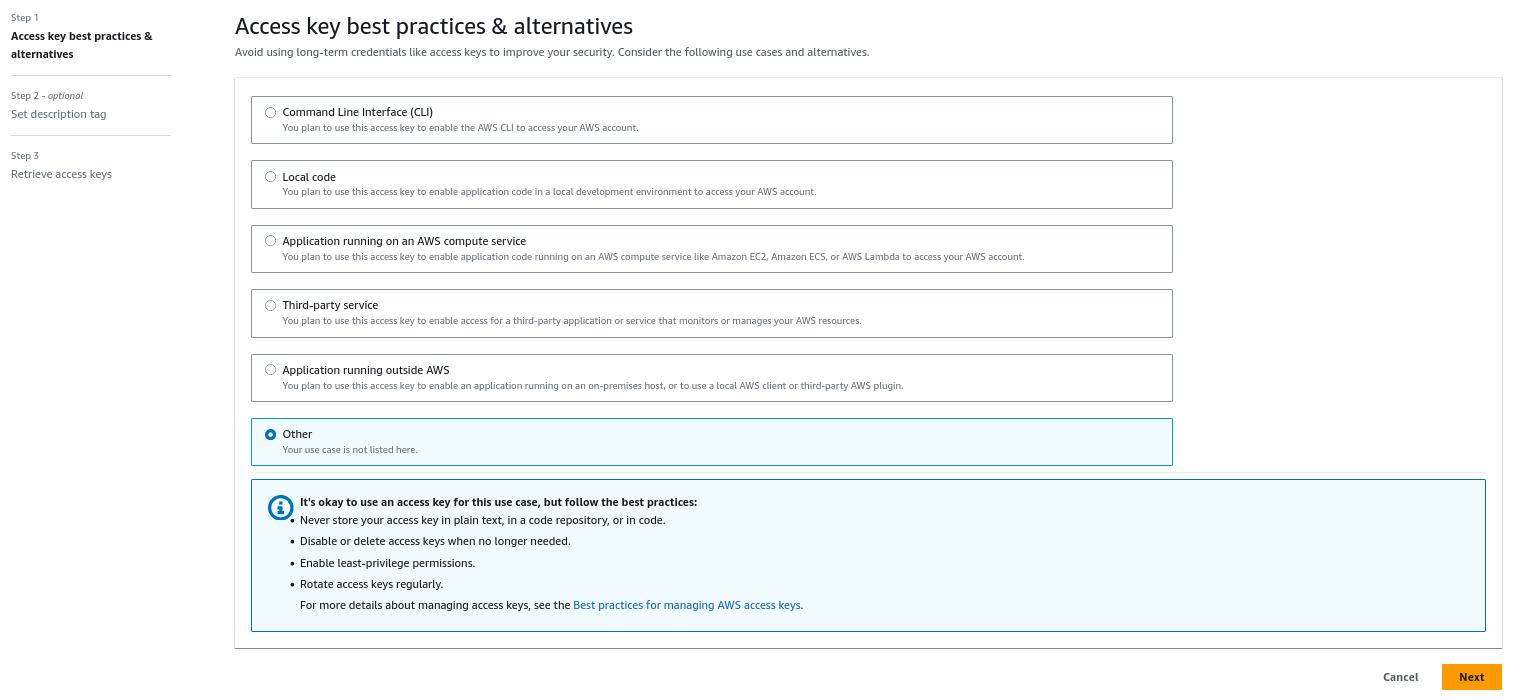
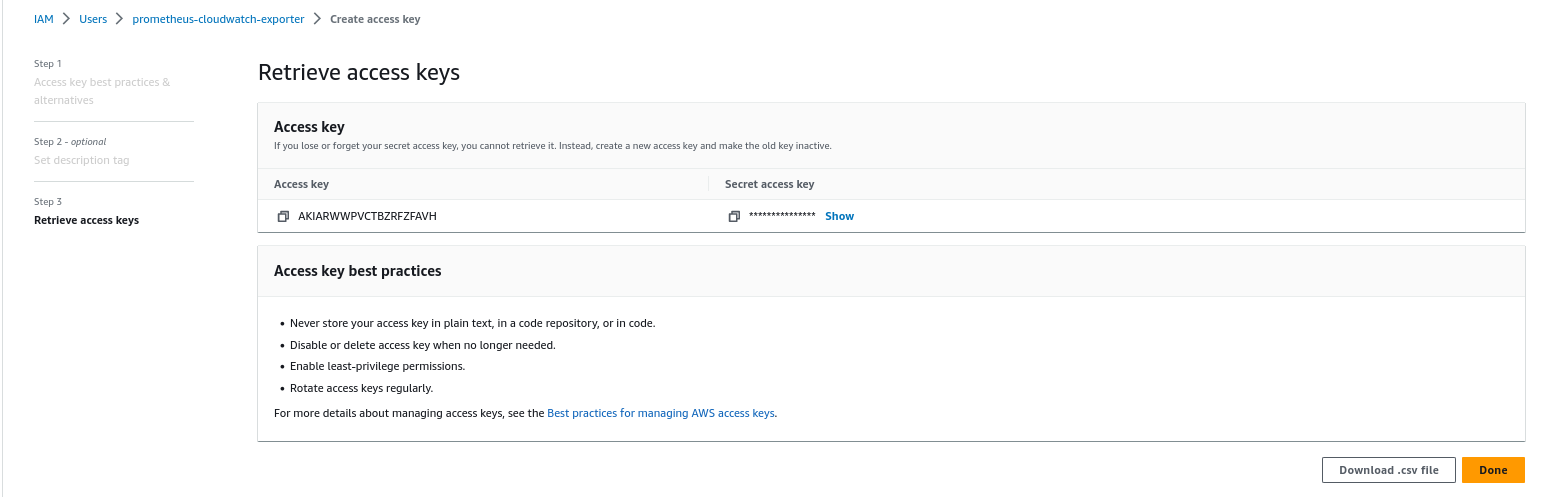
Generate Access keys for “prometheus-cloudwatch-exporter” IAM user:
Prometheus CloudWatch Exporter
Prometheus CloudWatch Exporter
Prometheus CloudWatch Exporter
2. Download cloudwatch-exporter helm chart:
helm fetch prometheus-community/prometheus-cloudwatch-exporter
tar -xf prometheus-cloudwatch-exporter-0.24.0.tgz
rm prometheus-cloudwatch-exporter-0.24.0.tgz
3. Create additional values file where we will override default values:
Add config for scraping Storage, Memory and CPU. You can add all metrics that CloudWatch has but every request to Cloudwatch cost money, so I recommend getting only the metrics needed for alerts. For observability, use simple CloudWatch datasource in the Grafana:
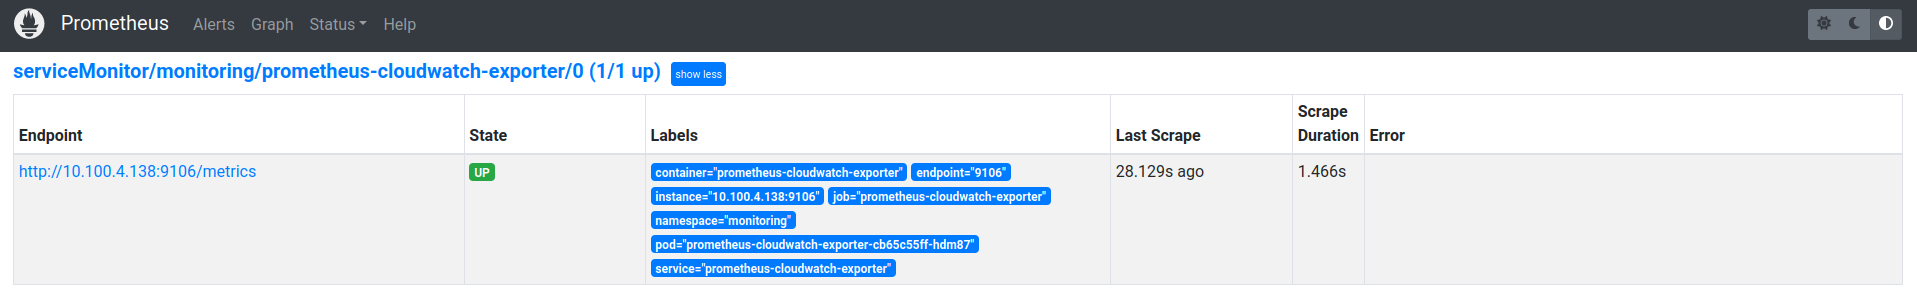
6. Again wait few min and you will see in the Prometheus new target:
Prometheus
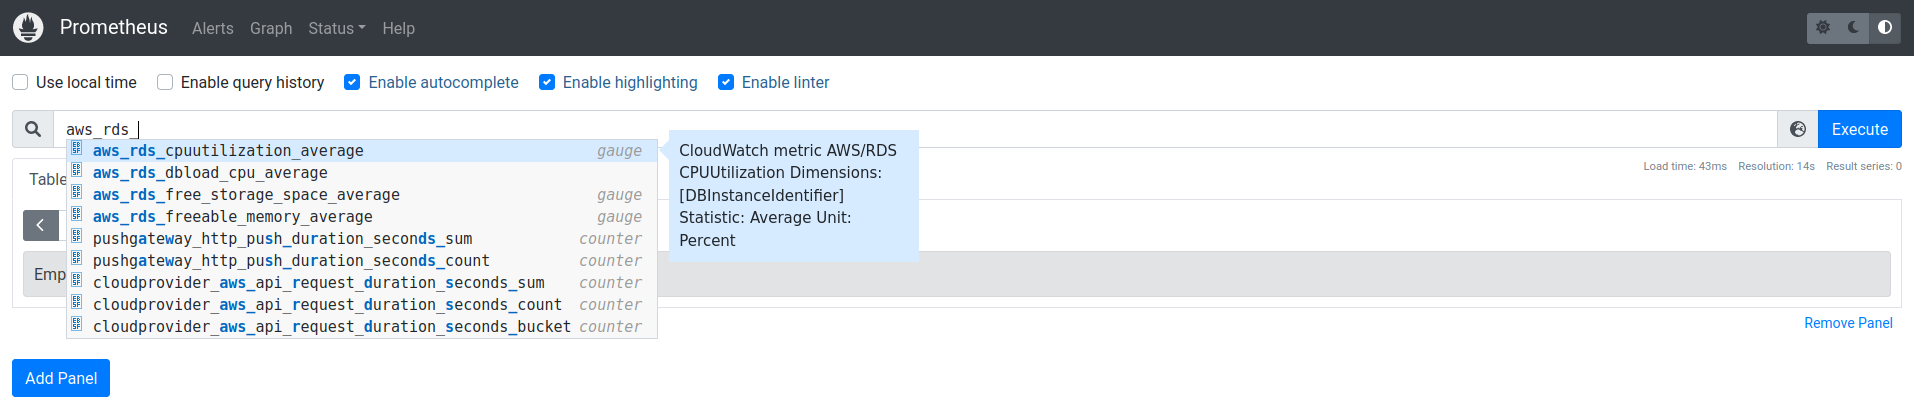
new metrics:
Prometheus
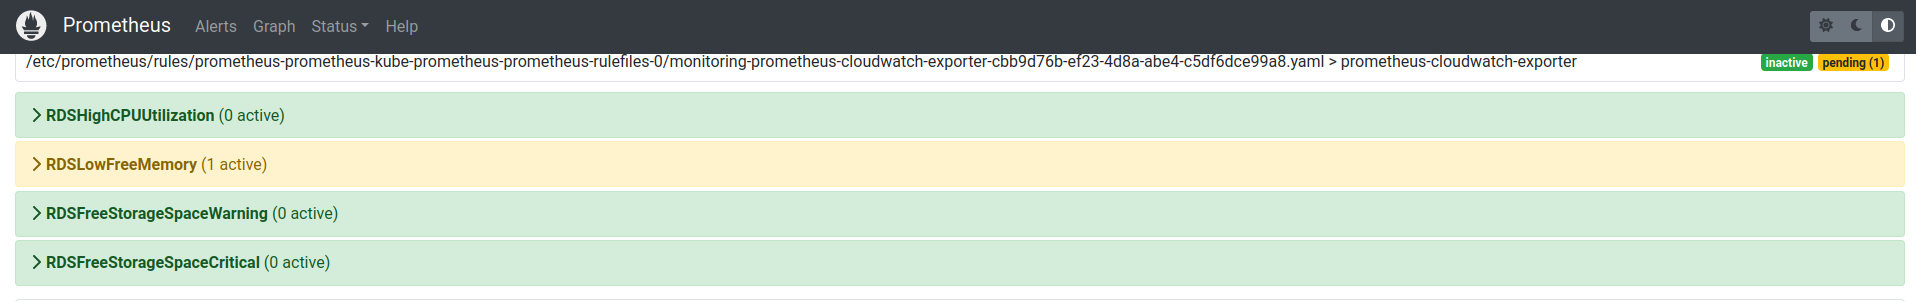
and Alerts
Prometheus
Grafana
Once everything works we can add the dashboard to the Grafana. I uploaded my dashboard to the grafana.com and you can import it with ID 18517.
Grafana
Grafana
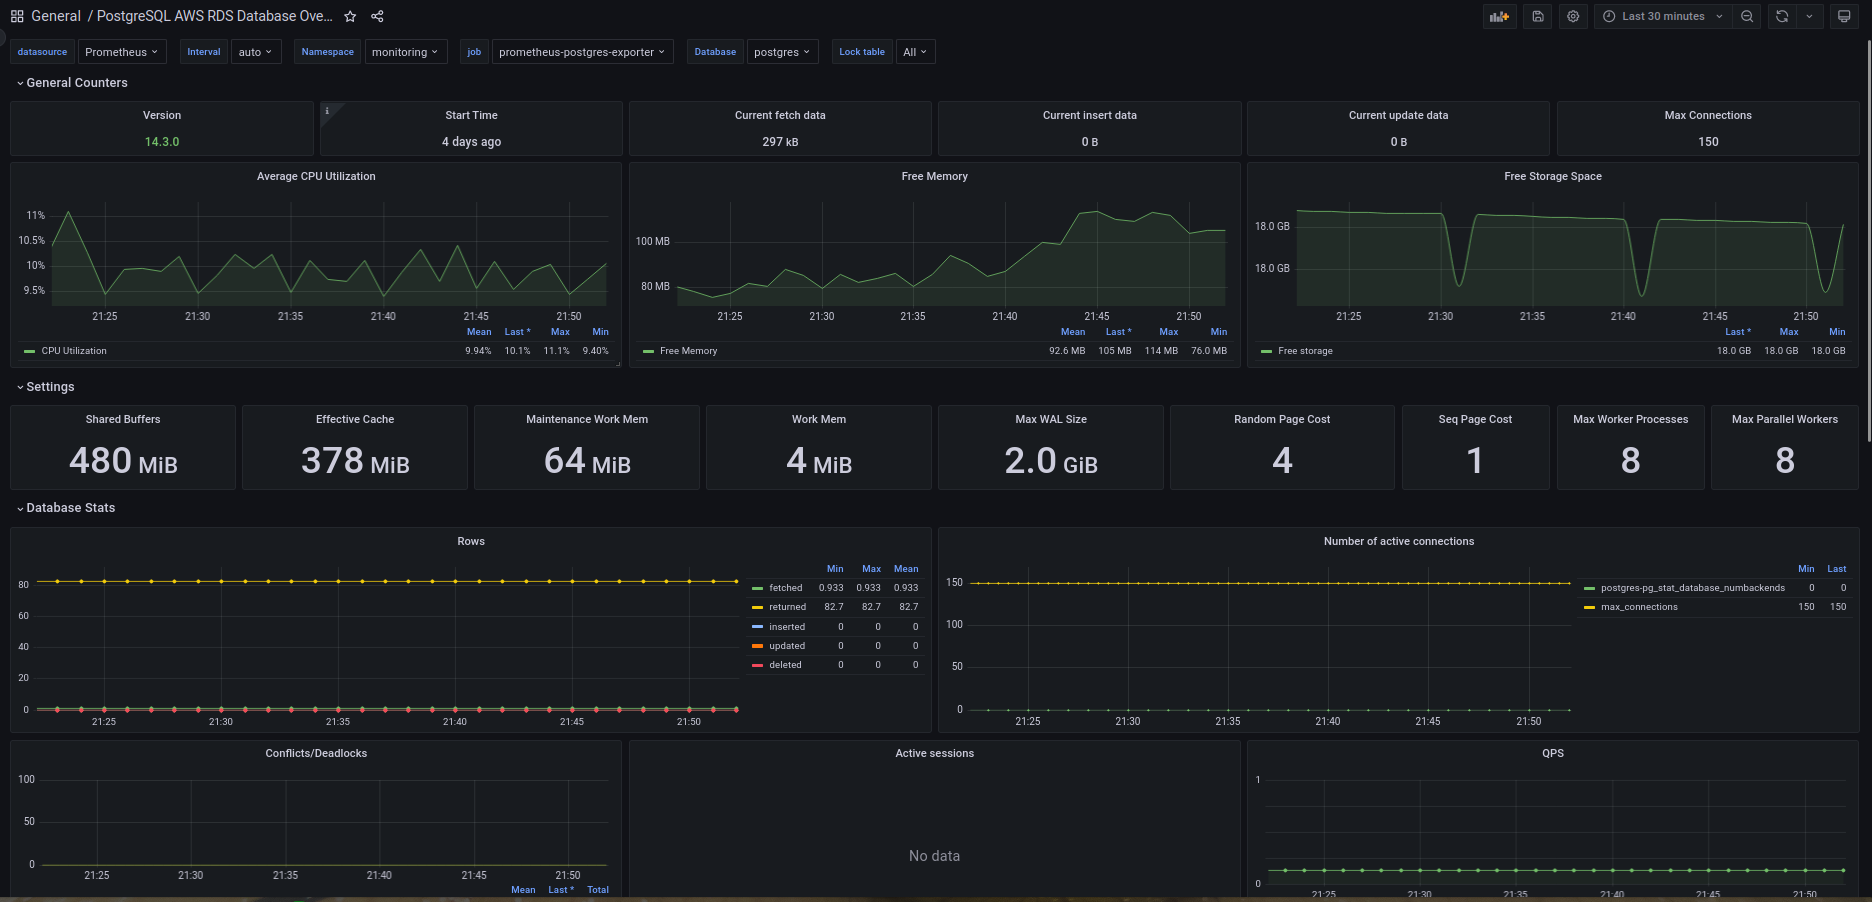
In conclusion, monitoring your PostgreSQL RDS instance on AWS using Prometheus Operator, exporters, and Grafana dashboard is a best practice that can help you optimize your database's performance, availability, and reliability. By implementing a comprehensive monitoring and alerting system, you can stay on top of critical metrics and identify potential issues before they escalate into bigger problems.
Although the initial setup may seem daunting, the benefits of a well-designed monitoring system outweigh the effort required to set it up. Additionally, the process of regularly reviewing the collected metrics and alerts and fine-tuning the monitoring system is a critical aspect of maintaining optimal database performance.
Dashboad
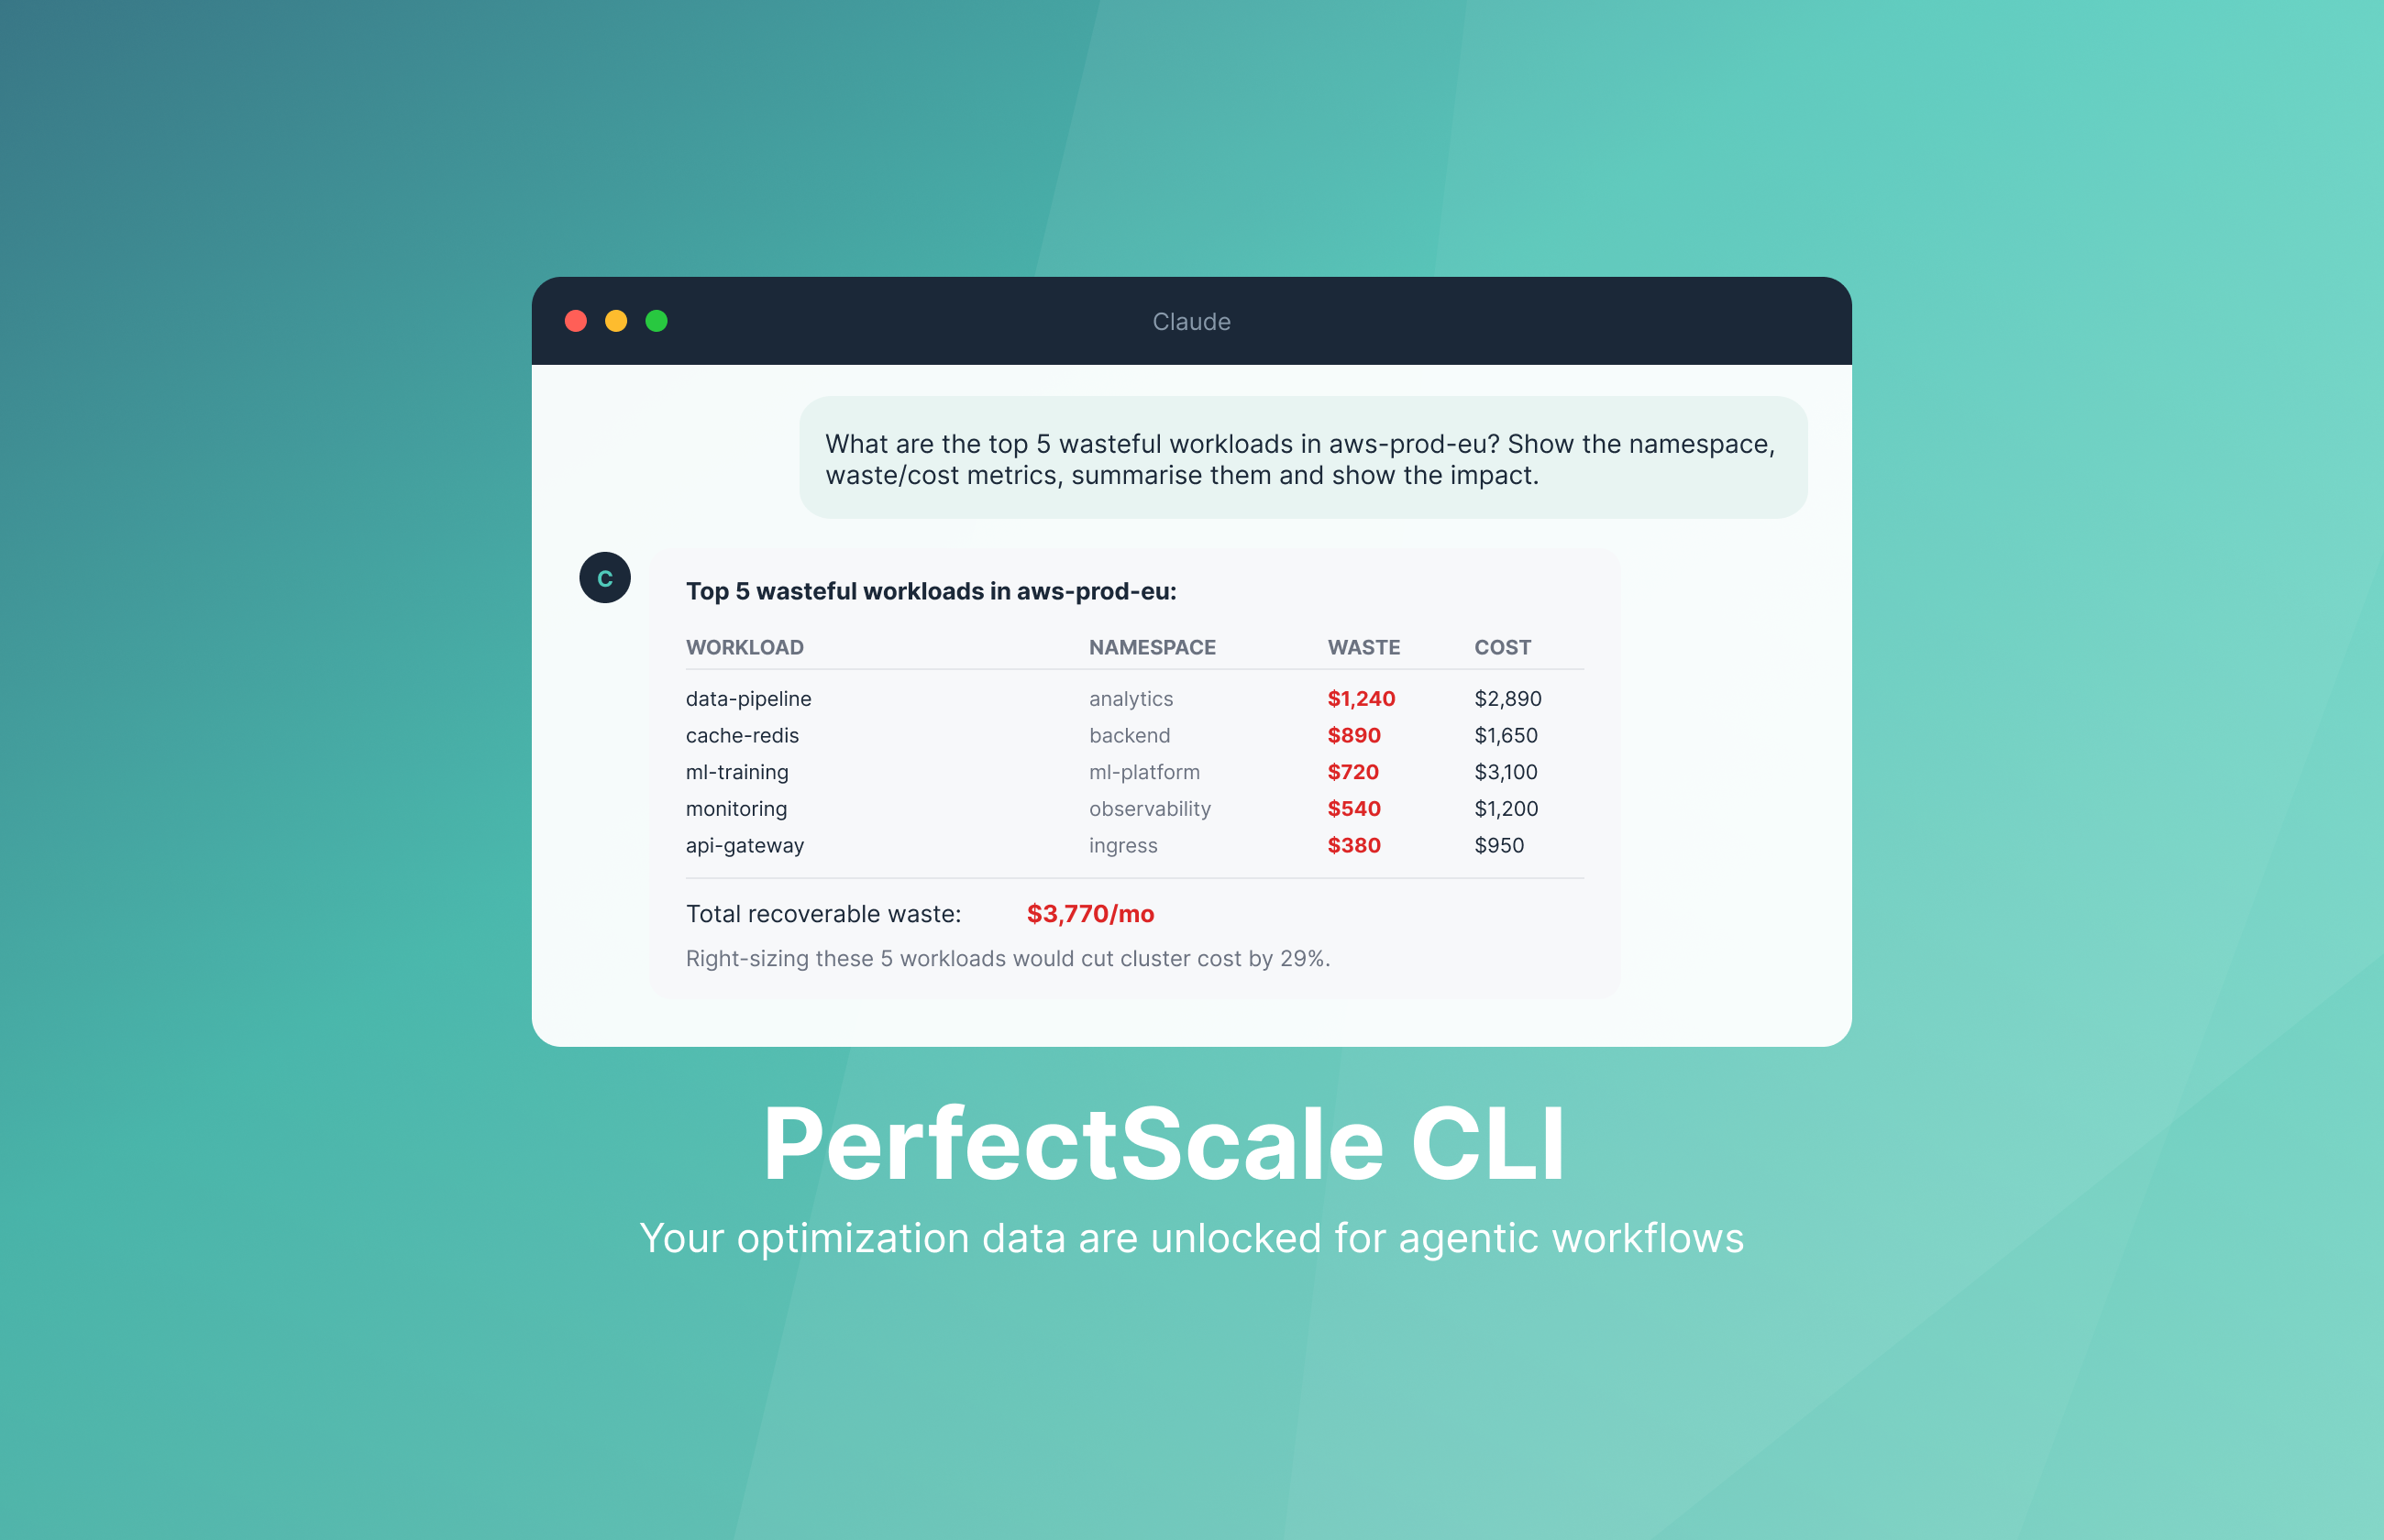
Now that you've set up comprehensive monitoring for your RDS PostgreSQL database, take the next step in optimizing your entire Kubernetes infrastructure. Don't just monitor your resources – optimize them intelligently. Our advanced algorithms and machine learning techniques ensure your workloads are optimally scaled, reducing waste and cutting costs without compromising performance. Join forward-thinking companies who have already optimized their Kubernetes environments with PerfectScale. Sign up and Book a demo to experience the immediate benefits of automated Kubernetes cost optimization, resource management. Ensure your environment is always perfectly scaled and cost-efficient, even when demand is low.
Reduce your cloud bill and improve application performance today
Install in minutes and instantly receive actionable intelligence.
By clicking “Accept”, you agree to the storing of cookies on your device to enhance site navigation, analyze site usage, and assist in our marketing efforts. View our Privacy Policy for more information.


.png)


.png)


.png)