Subscribe to our newsletter
Thank you! Your submission has been received!
Oops! Something went wrong while submitting the form.

Kubernetes cost optimization refers to managing and reducing the expenses associated with running applications on Kubernetes clusters by efficiently utilizing resources like CPU, memory, and storage, thereby avoiding overprovisioning and waste.
You've deployed your Kubernetes cluster, and your app is running. Now comes the hard part: keeping it efficient, without overspending.
It’s not just about saving money. It’s about balancing cost, resilience, and performance. Cut too much, and you risk outages. Overprovision, and you pay for resources you don’t need.
This guide explores the essential components of Kubernetes cost optimization, providing actionable insights and examples. We'll explore the top 10 strategies, such as right-sizing pods and containers, implementing resource quotas, utilizing autoscaling mechanisms, and more.
Main takeaways from this article:

Kubernetes cost optimization starts with understanding what you’re actually paying for and why those costs can be so unpredictable and hard to control.
In traditional infrastructure, you buy or rent a fixed number of servers. In Kubernetes, you define what your applications need, and the system tries to make sure those requests are met. This abstraction is powerful, but it also creates a disconnect between what's allocated and what you are charged for.
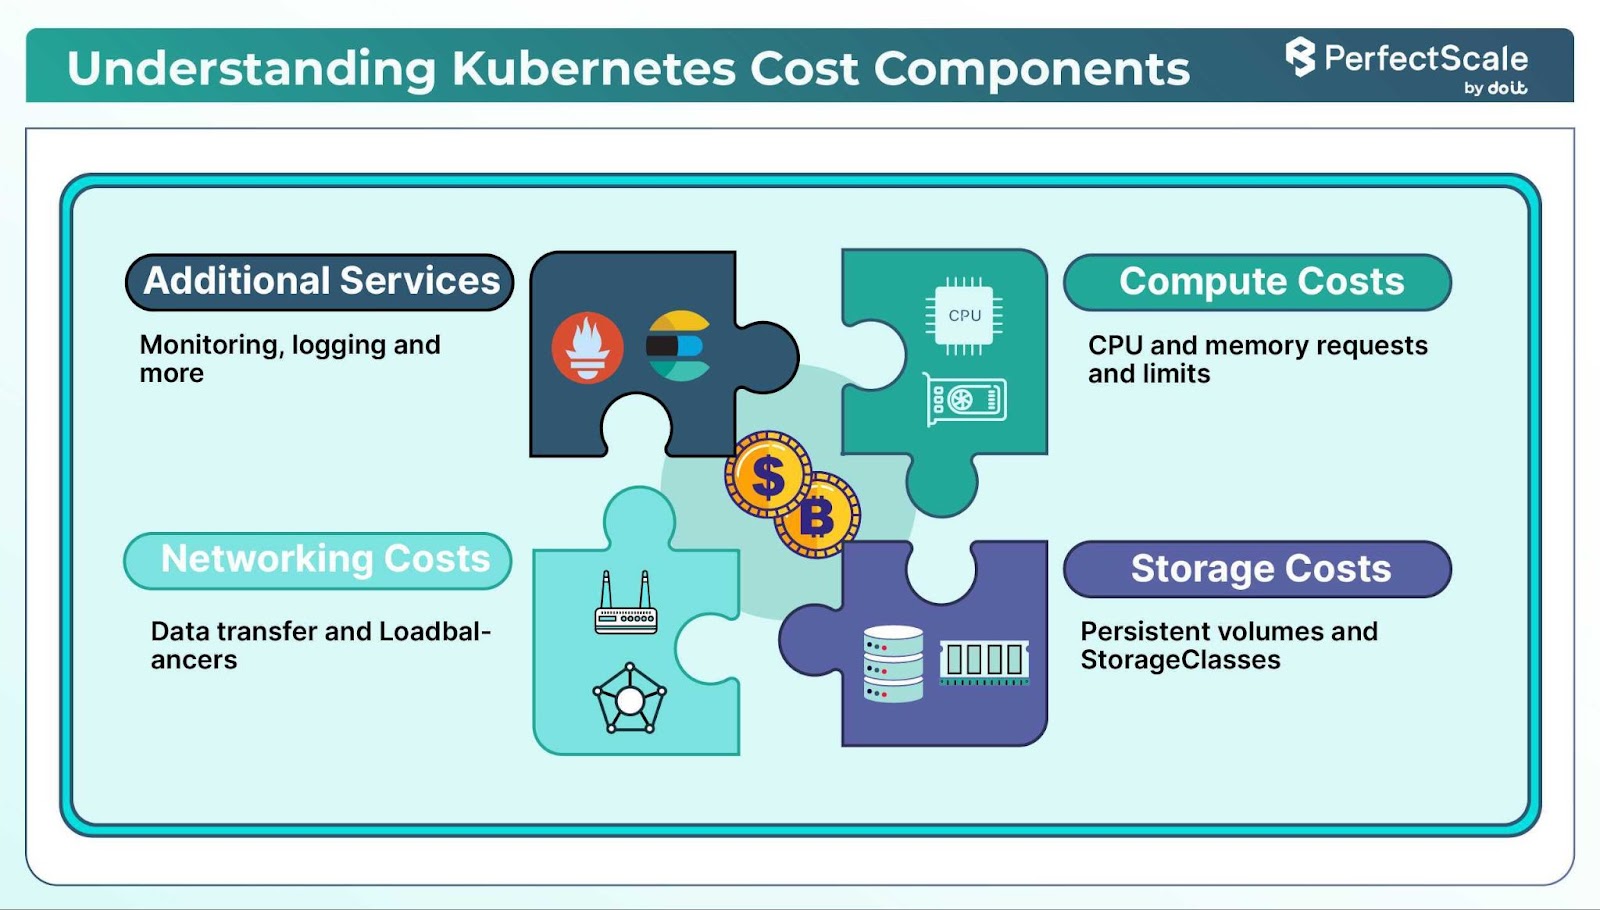
Here are the four major Kubernetes cost drivers:
Compute resources are a significant portion of Kubernetes costs. Each pod specifies CPU and memory requests and limits for each of its containers, which determine its allocated resources. Overprovisioning (allocating more resources than necessary) can lead to underutilized infrastructure and increased costs. Conversely, underprovisioning may cause performance issues.
Storage costs in Kubernetes arise from using Persistent Volumes (PVs) and the choice of StorageClasses (e.g., HDD vs. SSD). Block‑based Persistent Volumes work best for low‑latency workloads like databases. But if you don’t need a full file system, you can optimize costs by using object storage services like Amazon Simple Storage Service or Google Cloud Storage instead of Persistent Volumes. Object storage scales virtually without limit, charges per gigabyte stored, and suits use cases like logs, static files, and backups. With CSI drivers, you can mount object storage buckets into Kubernetes workloads easily.
Networking costs include data transfer between services, the use of LoadBalancers, Ingress Controllers, and traffic crossing between zones. Also, every node has limits on network interfaces and IP addresses per interface, which limits how many pods can run per node. When you hit these limits, you must add more nodes, resulting in additional network interfaces, increased inter-zone traffic, and higher costs.
Ancillary services like monitoring, logging, and continuous deployment tools contribute to the overall cost of running Kubernetes clusters. These services run as sidecar containers or separate pods, consuming compute and storage resources. In addition, third-party observability services charge per the number of monitoring agents and the volume of collected metrics and logs.
Let’s discuss the tools that enable organizations to track resource usage, identify inefficiencies, and implement strategies to reduce expenses:
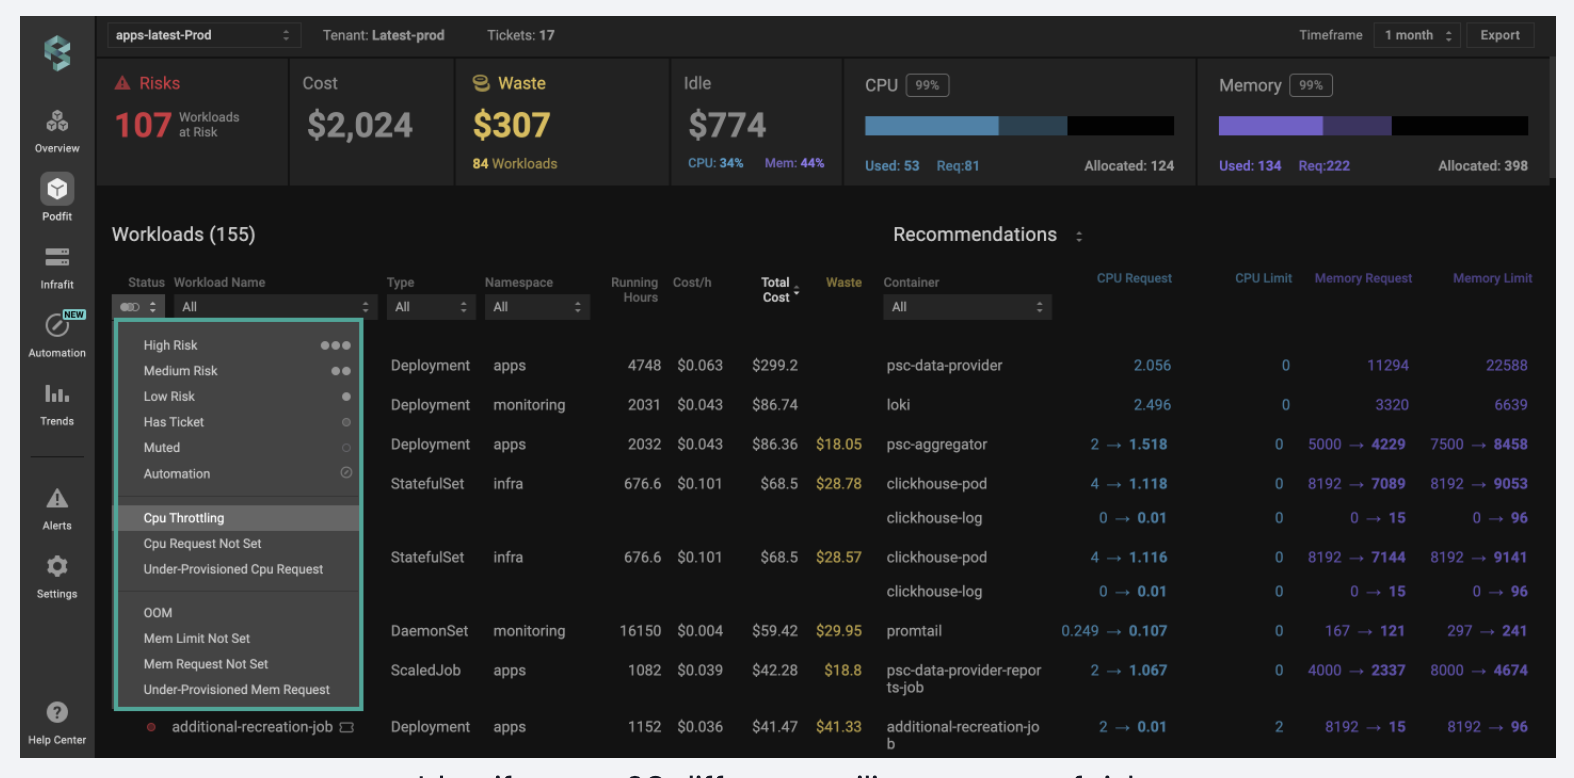
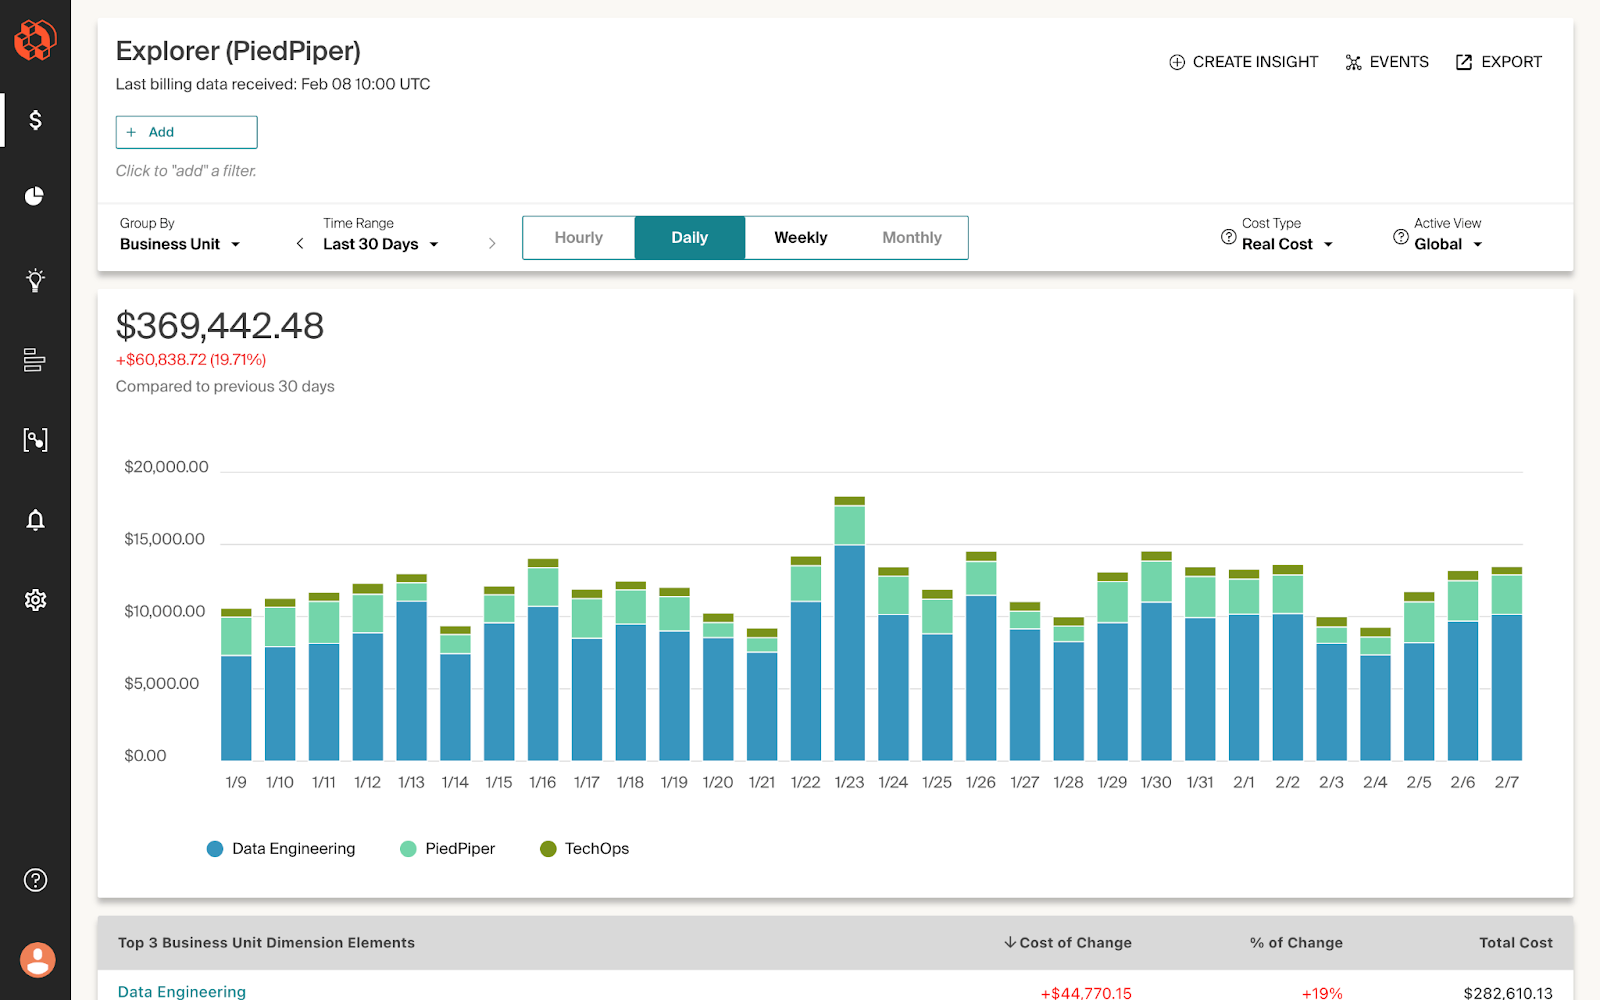
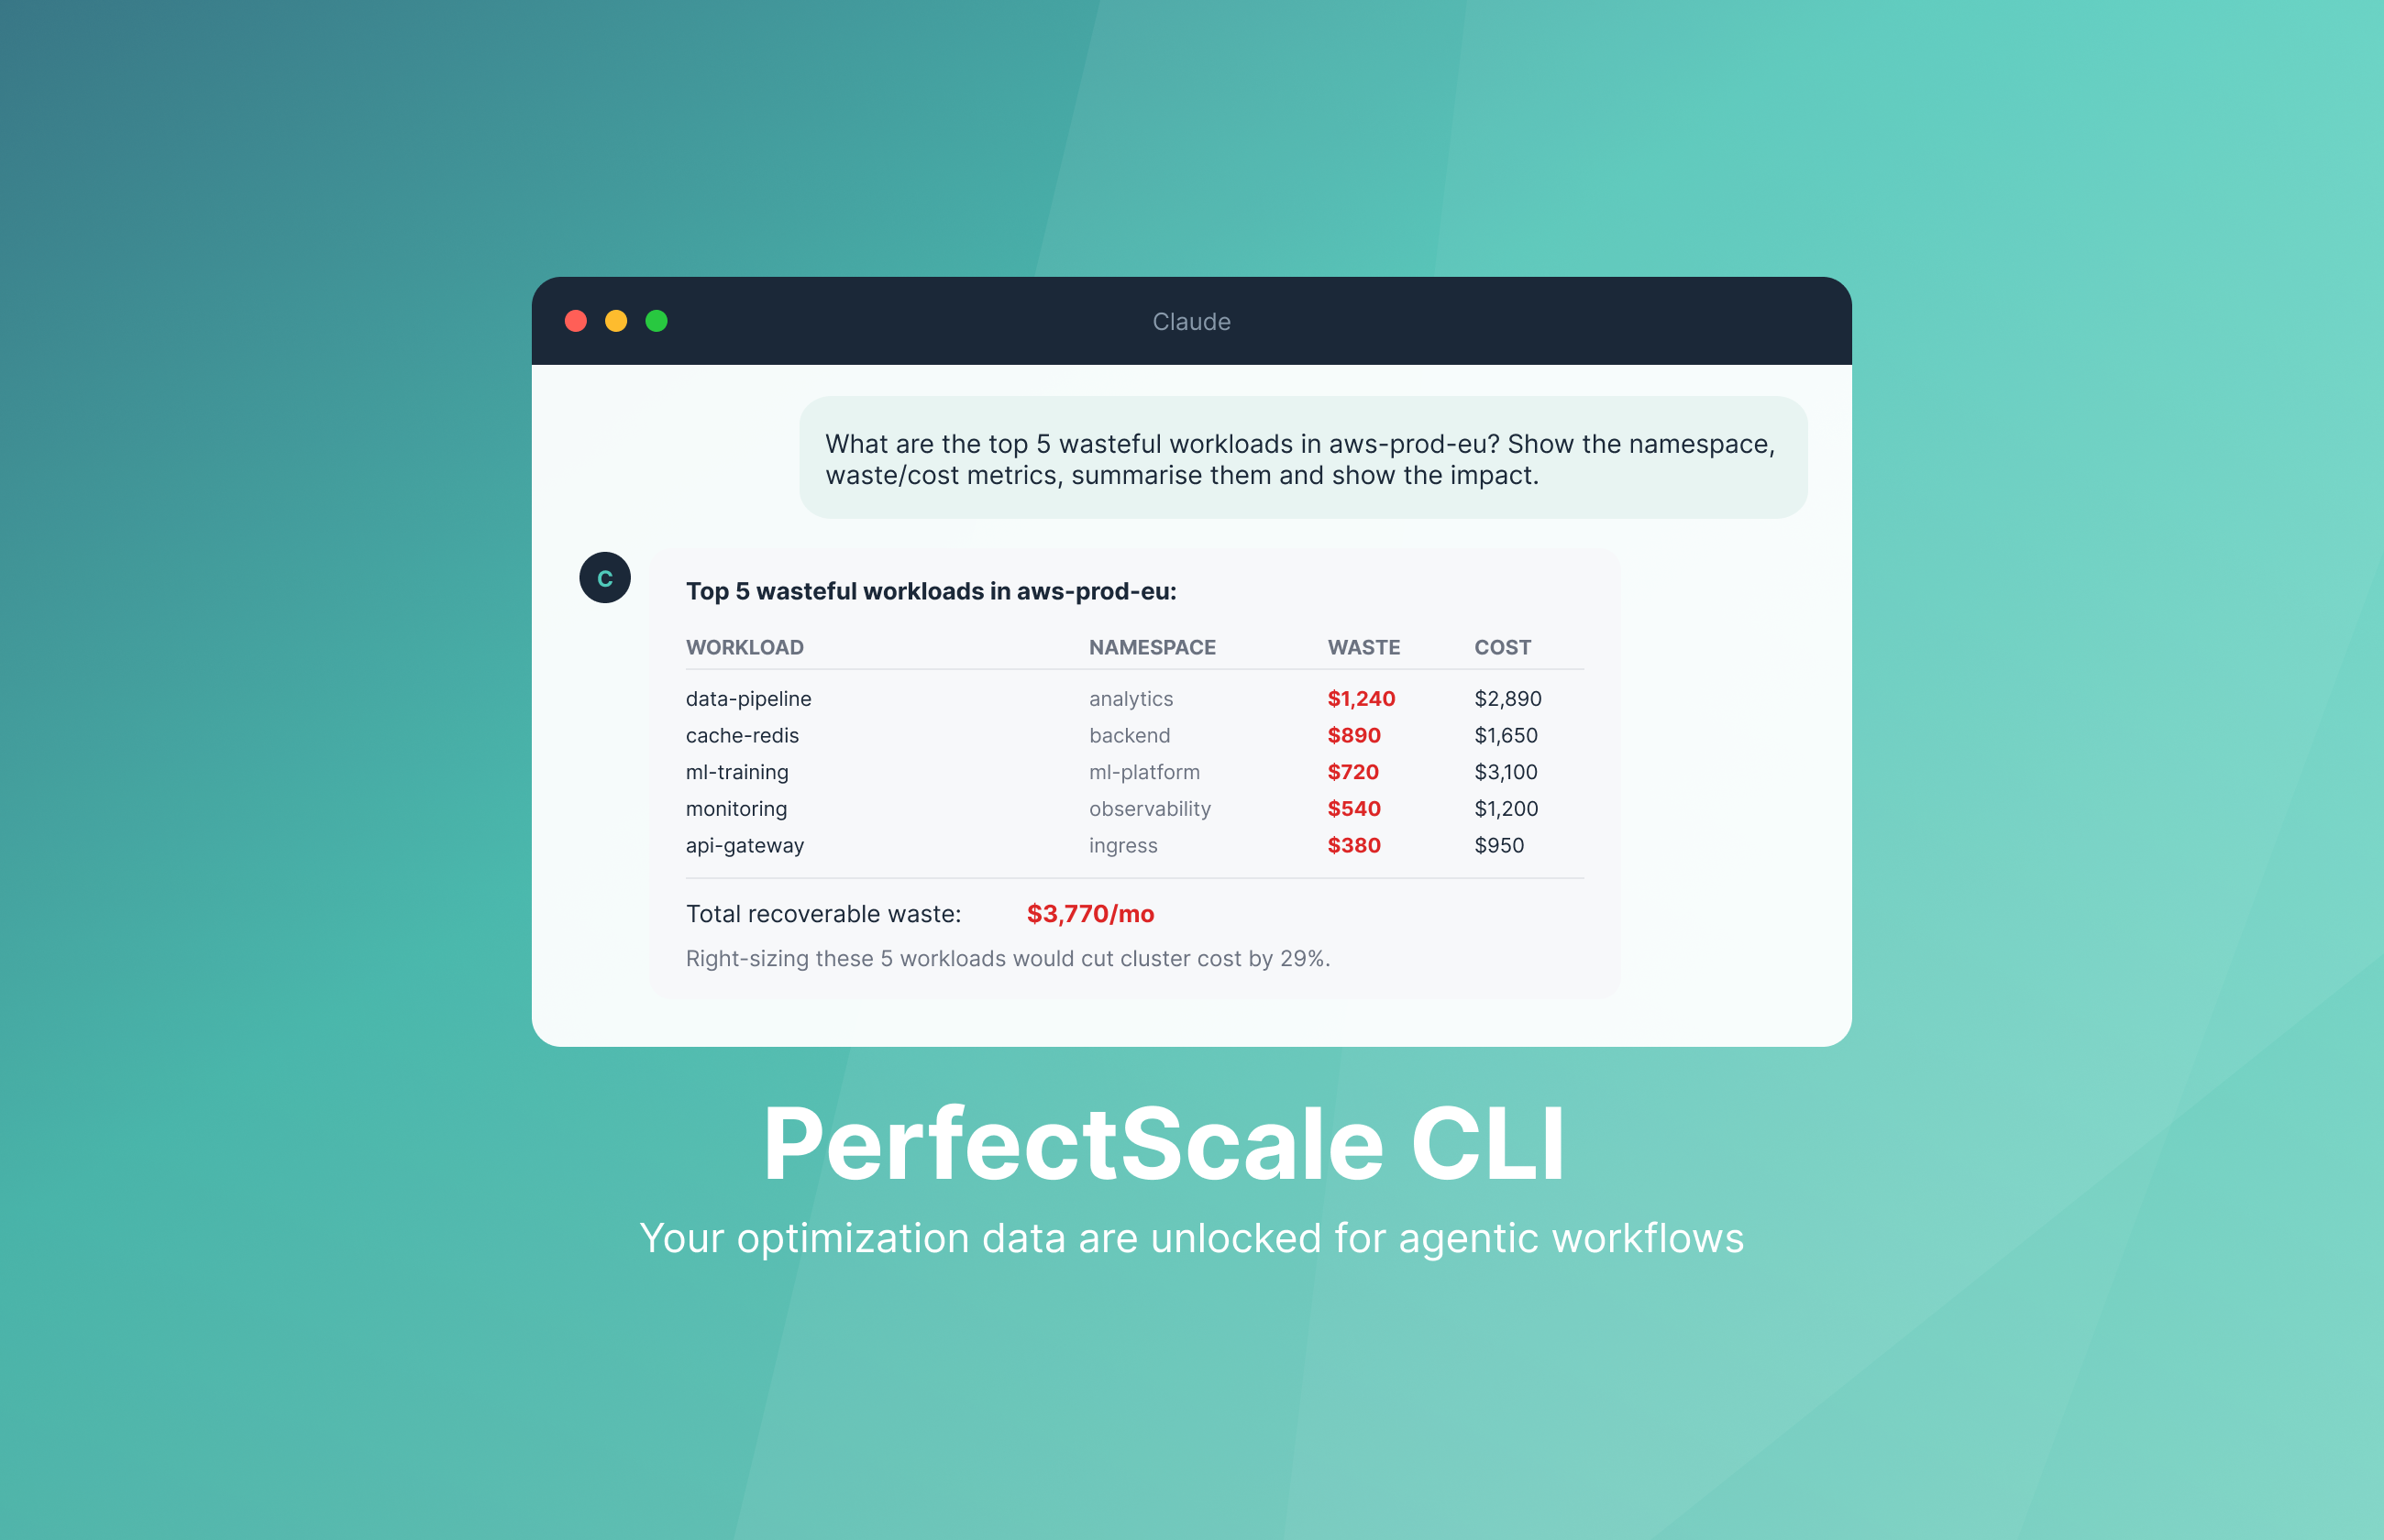
PerfectScale by DoiT is a trusted tool that helps engineers automatically optimize Kubernetes. It makes it easy to fine-tune your environment, allocate resources efficiently, and lower cloud costs, while maintaining peak performance and full visibility.
Whether you're running on EKS, GKE, AKS, KOPS, or even a private cloud, PerfectScale integrates seamlessly into your environment to give you granular control with zero guesswork.
→ Get a full risk and cost breakdown within 5 minutes of deploying a single Helm command.
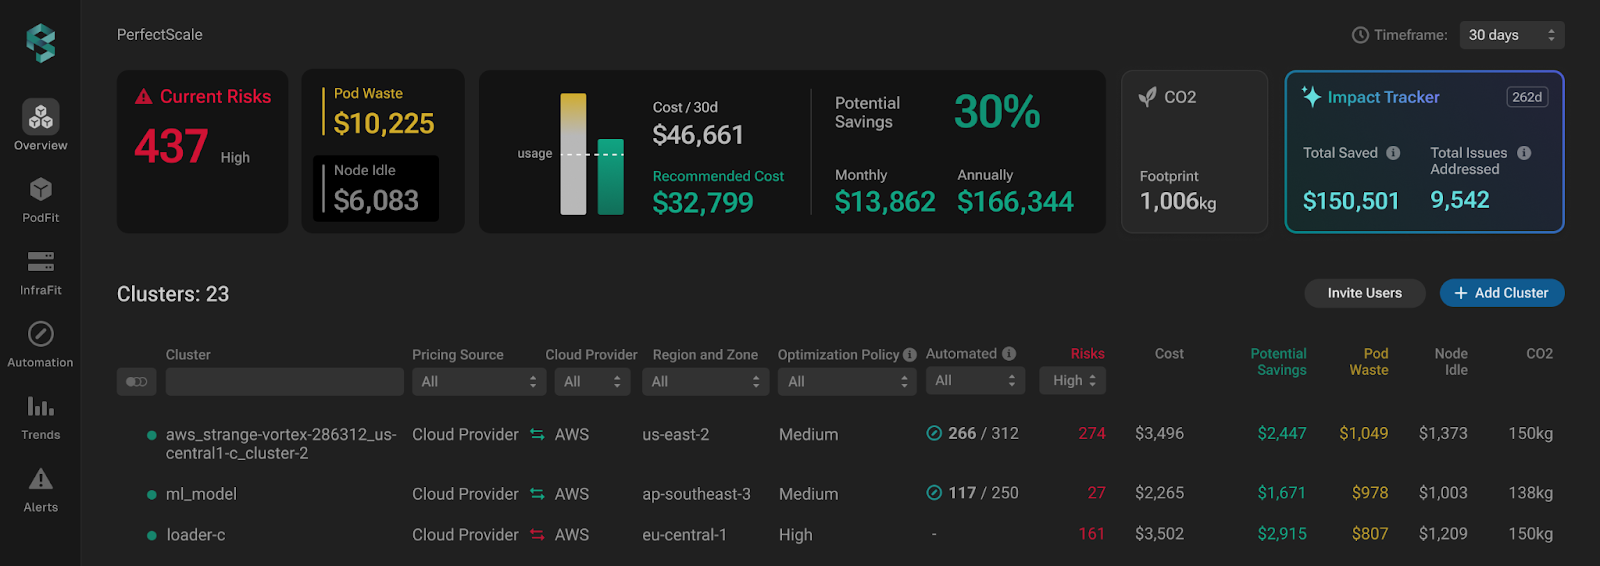
→ Receive data-driven, safe-to-apply recommendations based on actual usage.
→ Autonomously tune CPU/memory requests and limits for immediate results.
→ Continuously monitor cost, risk, and performance metrics across all workloads from a single pane of glass and identify where to focus your efforts with ease.
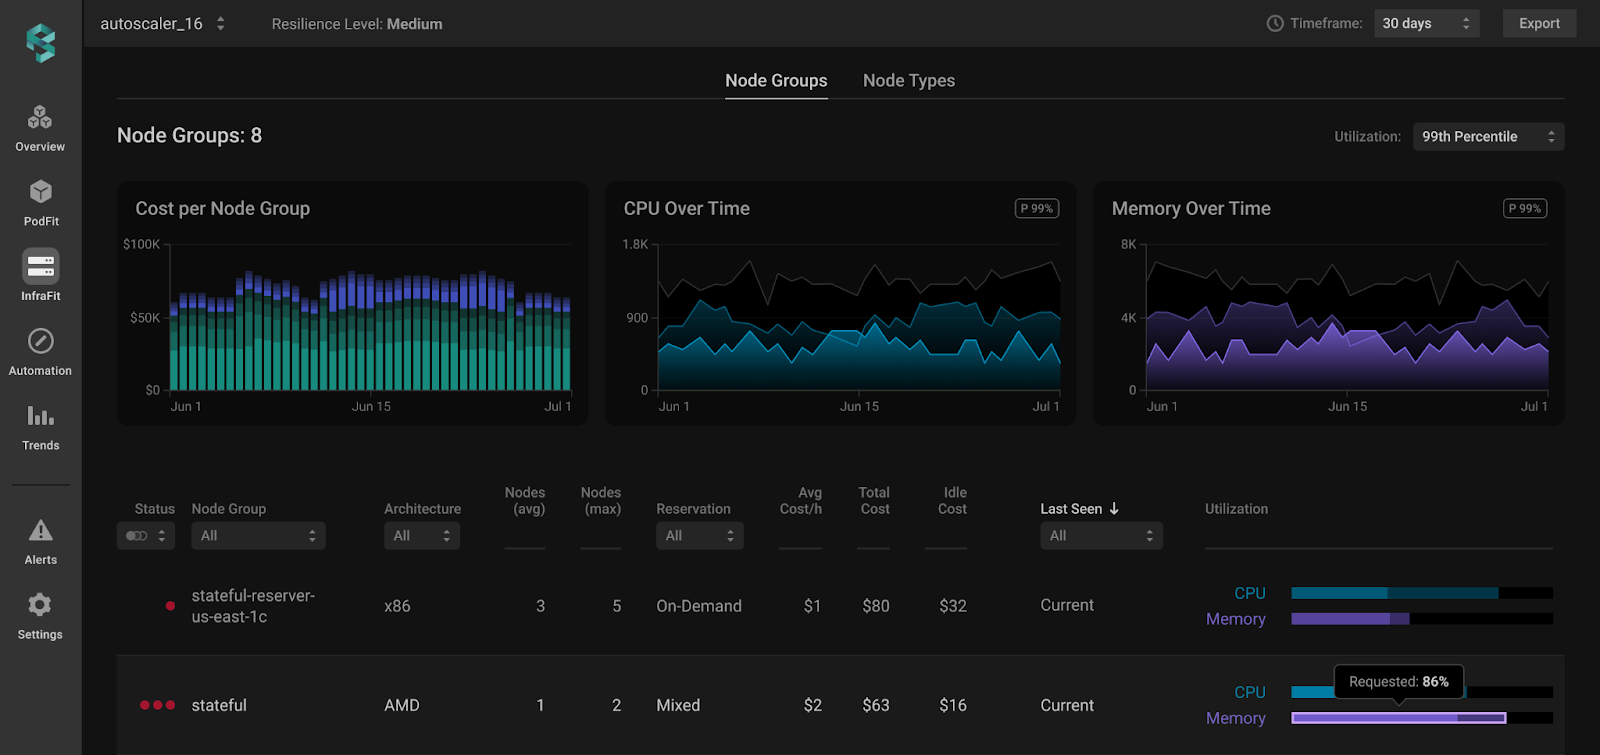
→ Instantly identify up to 30 resilience risks and address them with impact-driven prioritization before they escalate.
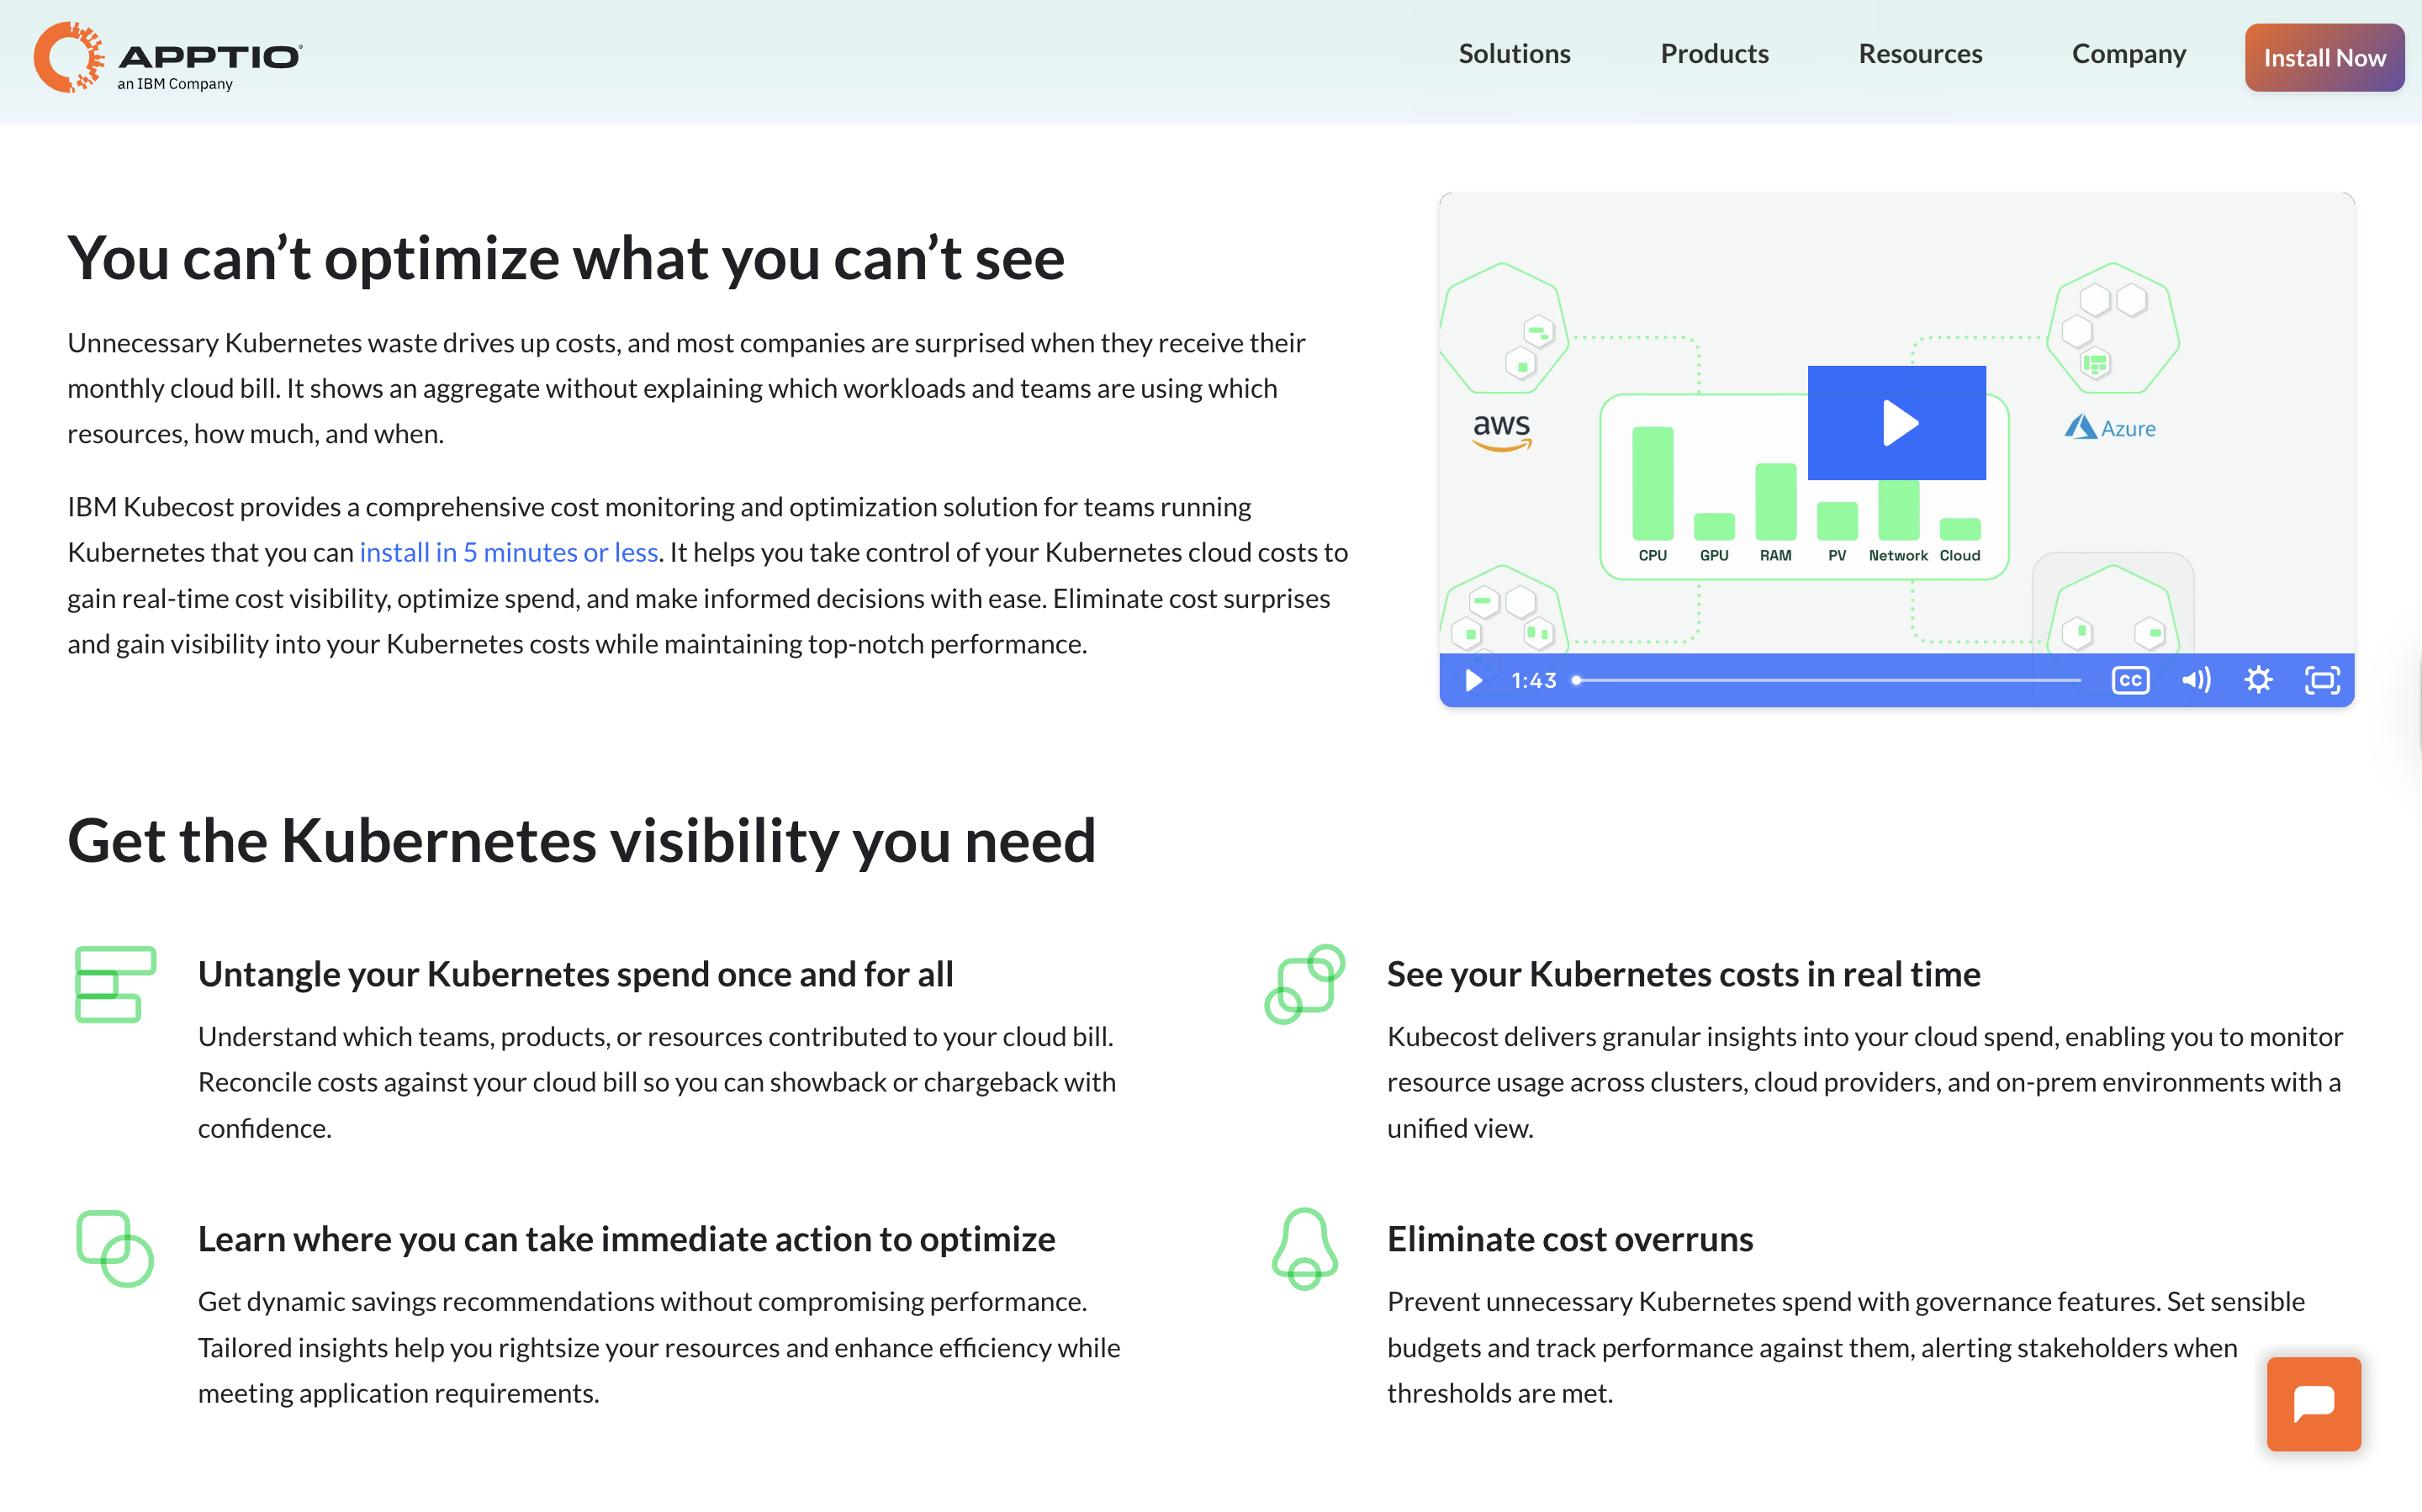
IBM Kubecost provides cost monitoring and insights into Kubernetes spending. It helps you take control of your Kubernetes cloud costs to gain real-time cost visibility, optimize spend, and make informed decisions with ease. Eliminate cost surprises and gain visibility into your Kubernetes costs while maintaining top-notch performance.
CAST AI is a Kubernetes management platform that uses automation to optimize cloud resource usage. It offers tools for implementing cost-saving strategies for Kubernetes clusters, such as instance selection, rightsizing, and dynamic rebalancing. CAST AI helps make adjustments in resource allocation based on workload demands. It dynamically scales resources down during low usage or switches to more cost-effective options automatically.
CloudZero offers cost intelligence by correlating cloud spend with business metrics. It enables organizations to understand the financial impact of their Kubernetes workloads in the context of overall business operations. By providing insights into cost per customer, product, or feature, CloudZero helps teams align engineering decisions with financial objectives, fostering a culture of cost accountability and efficiency.
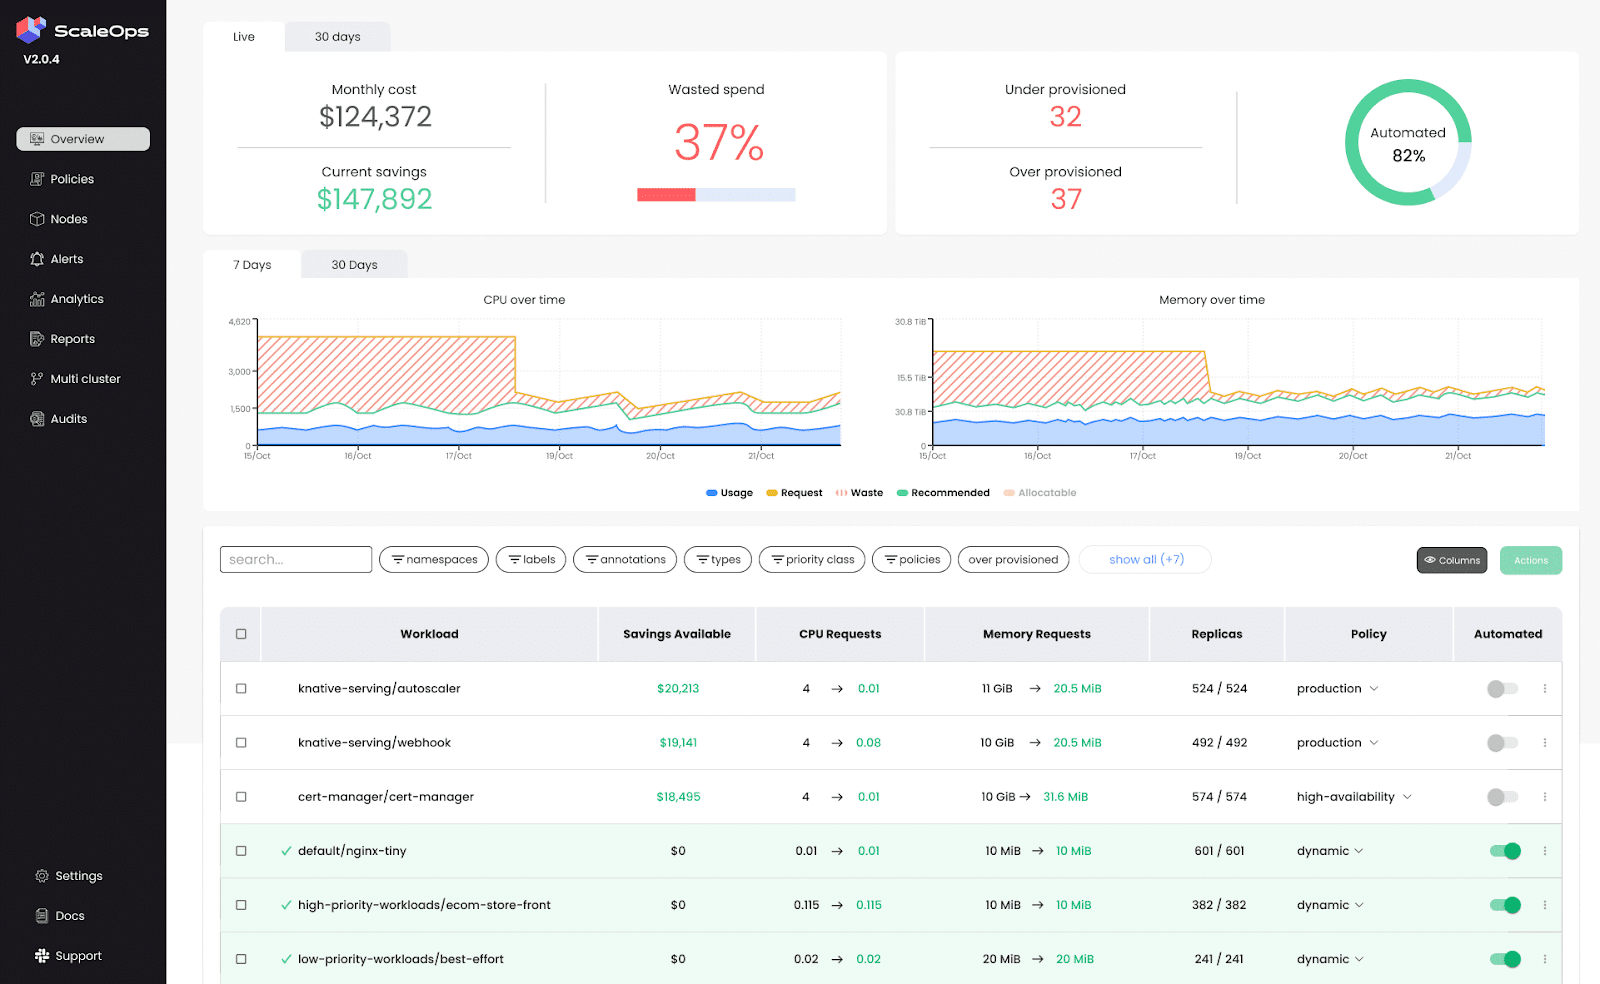
ScaleOps is an automated platform designed for Kubernetes resource optimization. It enhances cost-efficiency by dynamically adjusting pod and node configurations in real-time, ensuring that resources align with current demand without sacrificing performance. ScaleOps provides smart scaling policies and unified cost monitoring, offering visibility into resource costs across clusters, namespaces, and labels.
Let’s discuss the top 10 proven Kubernetes cost optimization strategies:
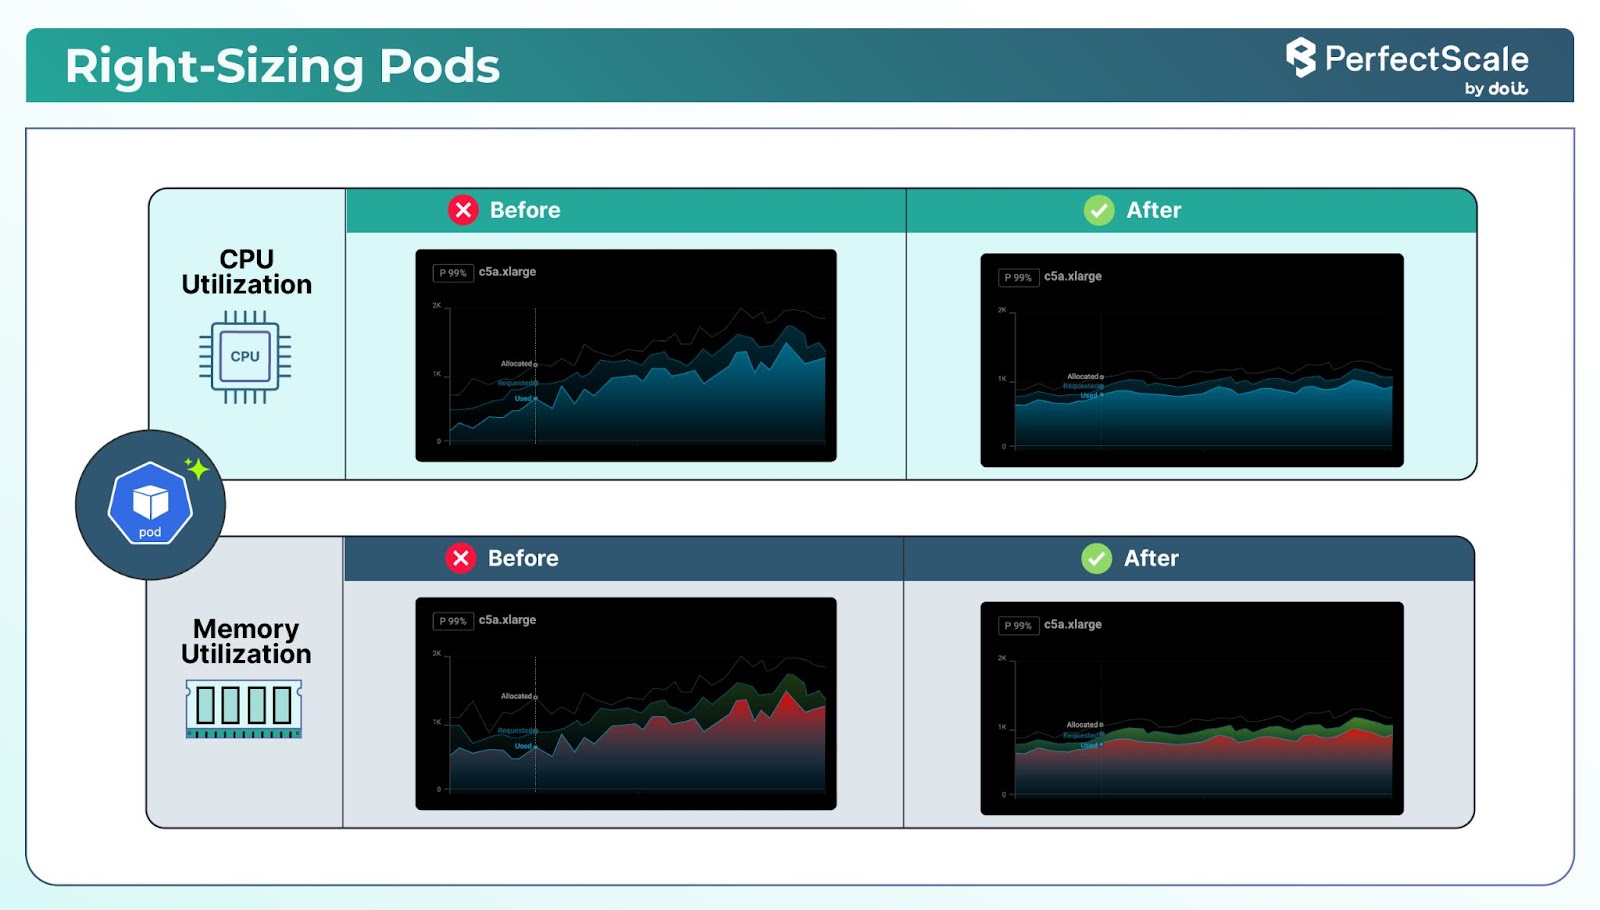
Right-sizing in Kubernetes involves aligning the resource requests and limits of pods and containers with their actual usage.
You should implement resource requests and limits in your containers.
apiVersion: apps/v1
kind: Deployment
metadata:
  name: sample-app
spec:
  replicas: 3
  selector:
    matchLabels:
      app: sample-app
  template:
    metadata:
      labels:
        app: sample-app
    spec:
      containers:
      - name: sample-container
        image: nginx
        resources:
          requests:
            cpu: "250m"
            memory: "256Mi"
Note: Our general recommendation or best practice is to omit the CPU limits. For more background, see the blog on Kubernetes CPU-limit best practices.
You can run kubectl top pod (or kubectl top pod -n <namespace>-- containers) to get real‑time CPU and memory usage (via Metrics Server), and for historical or trend analysis, use Prometheus with queries. This data helps you compare current consumption with configured requests/limits.
Pro Tip: Utilize PerfectScale to gather metrics on CPU and memory usage. This tool analyses historical and real-time data to provide insights into resource consumption patterns. Based on the collected data, you can modify the resource requests and limits to better match actual consumption.
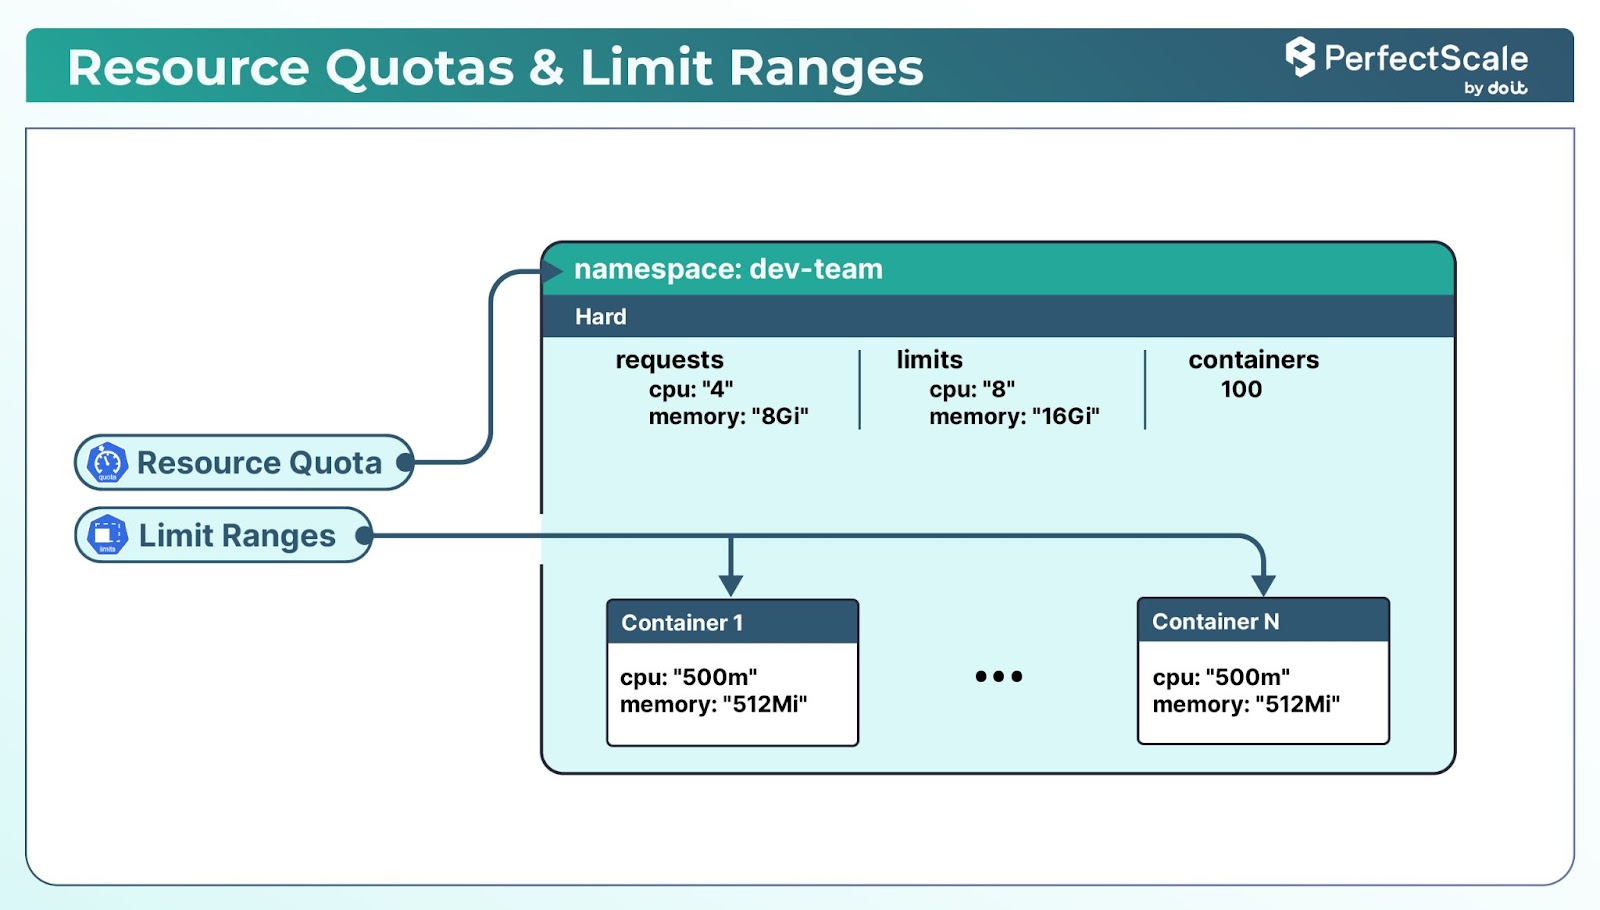
Resource quotas in Kubernetes control how much total CPU, memory, and other resources a namespace can use. Limits set the maximum amount of CPU and memory that individual pods or containers can consume.
apiVersion: v1
kind: ResourceQuota
metadata:
  name: compute-resources
  namespace: dev-team
spec:
  hard:
    requests.cpu: "4"
    requests.memory: 8Gi
    limits.cpu: "8"
    limits.memory: 16Gi
This ResourceQuota restricts the dev-team namespace to a maximum of 4 CPUs and 8Gi of memory for requests and 8 CPUs and 16Gi of memory for limits.
LimitRange:
apiVersion: v1
kind: LimitRange
metadata:
  name: container-limits
  namespace: dev-team
spec:
  limits:
  - default:
      cpu: "500m"
      memory: "512Mi"
    defaultRequest:
      cpu: "250m"
      memory: "256Mi"
    type: Container
This LimitRange sets default requests and limits for containers in the dev-team namespace.
This helps cluster admins define a default policy - e.g., disallow BestEffort pods. It also helps ensure that no single application consumes excessive resources, helping to ensure fair resource distribution across the cluster.
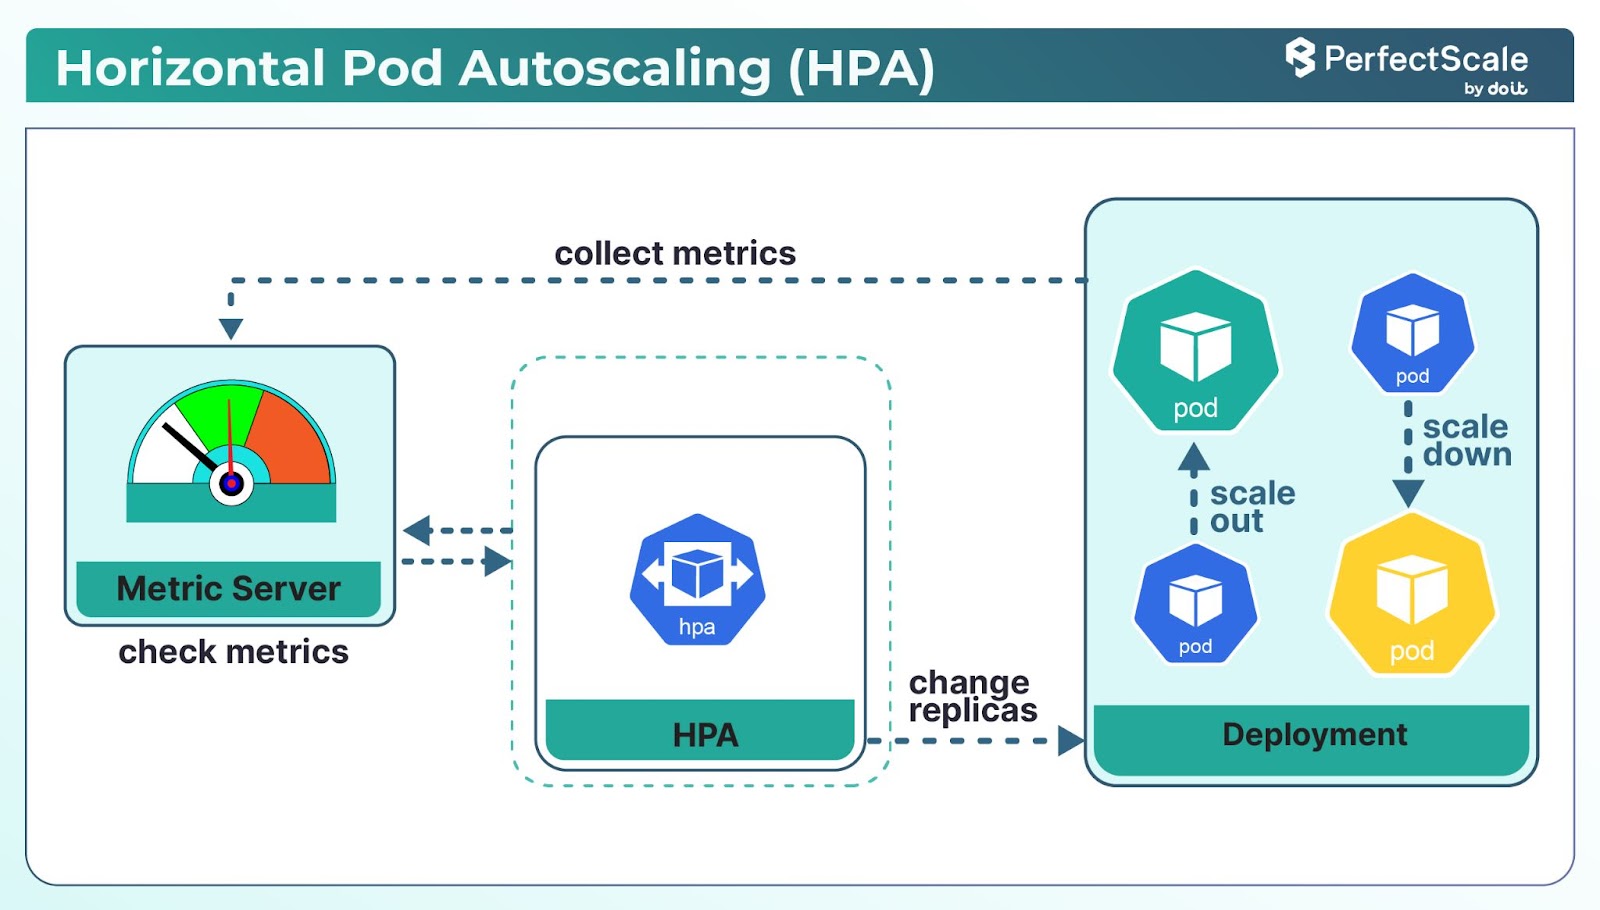
Horizontal Pod Autoscaler (HPA) automatically adjusts the number of pod replicas in a deployment based on observed metrics, such as CPU utilization.
Let’s discuss the key HPA settings:
minReplicas: It specifies the minimum number of pod replicas that HPA maintains.
maxReplicas: It defines the maximum number of pod replicas that HPA can scale up to.
metrics: It determines the target metrics for scaling. The commonly used metrics are:
CPU Utilization: Average CPU usage across pods.
Memory Utilization: Average memory usage across pods.
Custom Metrics: Application-specific metrics like request rates or queue lengths.
targetAverageUtilization: The desired average utilization across all pods.
desiredReplicas = ceil[currentReplicas * (currentMetricValue / desiredMetricValue)]For example, if you have 3 replicas with a current CPU utilization of 80% and a target of 50%, the calculation would be:
desiredReplicas = ceil[3 * (80 / 50)] = ceil[4.8] = 5So, HPA would scale up to 5 replicas.
While HPA enables your application to run only as many pods as needed, it does not reduce infrastructure spend if your underlying nodes remain statically provisioned. Without a scalable node pool, scaling pods up or down won’t impact your cloud bill, your nodes and their costs are always running.
To actually save money, HPA must be paired with a Cluster Autoscaler (CA):
1. When pod demand rises, HPA adds replicas and CA detects unschedulable pods → automatically adds nodes to accommodate them.
2. When demand drops, HPA scales down pods and CA terminates underutilized nodes, eliminating idle capacity instead of paying for unused servers.
Before implementing HPA, your cluster has a Metrics Server deployed and configured.
Deploy Metrics Server:
kubectl apply -f https://github.com/kubernetes-sigs/metrics-server/releases/latest/download/components.yaml
Run and check if your metrics server is running and exposing metrics properly:
kubectl get apiservices v1beta1.metrics.k8s.io -o yamlLook for the status section in the output to ensure it is available and the conditions are met.
Or
kubectl top pods -AIf the metrics server is running properly, you should see the CPU and memory usage for pods.
Create a deployment and expose it as a Service:
apiVersion: apps/v1
kind: Deployment
metadata:
  name: busyhttp-deployment
  namespace: hpa-test
spec:
  selector:
    matchLabels:
      app: busyhttp
  replicas: 1
  template:
    metadata:
      labels:
        app: busyhttp
    spec:
      containers:
      - name: busyhttp
        image: otomato/busyhttp
        ports:
        - containerPort: 80
        resources:
          limits:
            cpu: 500m
          requests:
            cpu: 200m
---
apiVersion: v1
kind: Service
metadata:
  name: busyhttp-service
  namespace: hpa-test
  labels:
    app: busyhttp
spec:
  ports:
  - port: 80
  selector:
    app: busyhttp
Apply the deployment and service:
kubectl create -f deployment.yaml

deployment.apps/busyhttp-deployment created
service/busyhttp-service created
Verify the deployment:
kubectl get deploy -n hpa-test

NAME                  READY   UP-TO-DATE   AVAILABLE   AGE
busyhttp-deployment   1/1     1            1           88s
Create the Kubernetes Horizontal Pod Autoscaler:
apiVersion: autoscaling/v1
kind: HorizontalPodAutoscaler
metadata:
  name: busyhttp-hpa
  namespace: hpa-test
spec:
  scaleTargetRef:
    apiVersion: apps/v1
    kind: Deployment
    name: busyhttp-deployment
  minReplicas: 1
  maxReplicas: 10
  targetCPUUtilizationPercentage: 50
Or you can even generate the YAML file with this command:
kubectl autoscale deployment busyhttp-deployment --min=1 --max=10 --cpu-percent=50 --namespace=hpa-test --name=busyhttp-hpa --dry-run=client -o yamlApply the HPA Kubernetes:
kubectl create -f hpa.yamlCheck the HPA Status:
kubectl -n hpa-test get hpa

NAME         REFERENCE                     TARGETS MINPODS MAXPODS REPLICAS     AGE
busyhttp-hpa Deployment/busyhttp-deployment 0%/50%   1       10         1            112s
Increase the Load:
kubectl -n hpa-test run -i --tty load-generator --rm --image=busybox --restart=Never -- /bin/sh -c "while sleep 0.01; do wget -q -O- http://busyhttp-service; done"Watch the load:
kubectl get hpa busyhttp-hpa --watch -n hpa-testNAME REFERENCE TARGETS MINPODS MAXPODS REPLICAS AGEbusyhttp-hpa Deployment/busyhttp-deployment 305%/50% 1 10 7 10mHere, CPU consumption has increased to 305% of the request. As a result, the Deployment was resized to 7 replicas.
Press CTRL-C to stop the load.
Check the Kubernetes HPA Status Again:
kubectl -n hpa-test get hpa

NAME         REFERENCE                      TARGETS   MINPODS   MAXPODS      REPLICAS    AGE
busyhttp-hpa Deployment/busyhttp-deployment  0%/50%    1                 10            1          20m
The load is normal now, hence the replicas are back down to 1. This doesn't happen immediately due to the cooldown period (defaults to 5 min) configured to stabilize the scaling behavior.
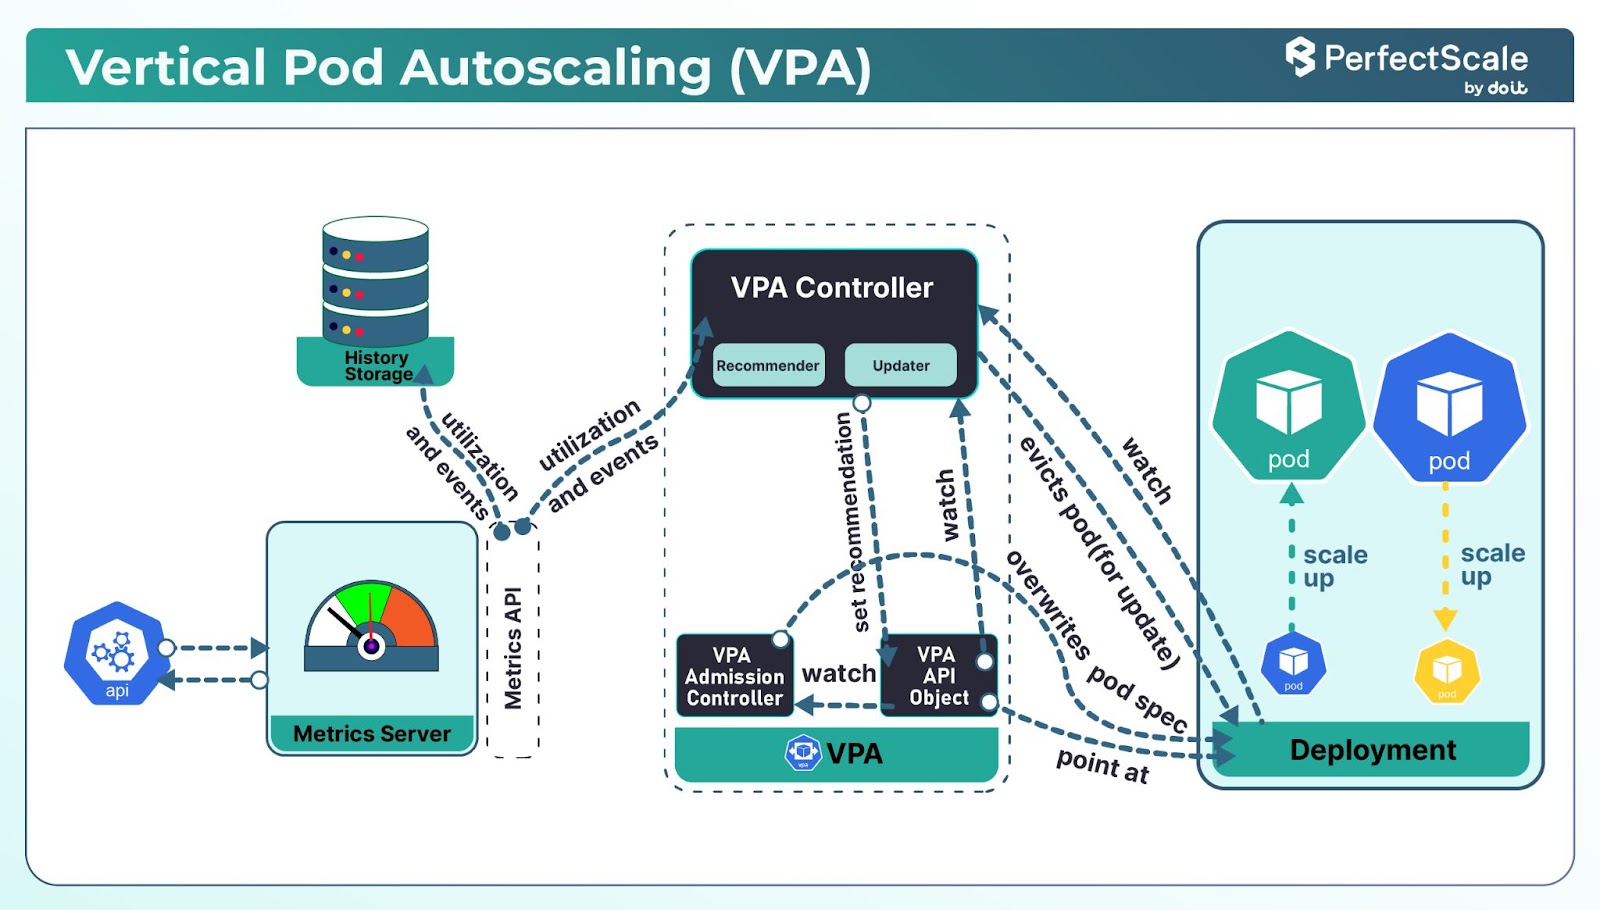
Vertical Pod Autoscaler (VPA) is a Kubernetes component that automatically adjusts the CPU and memory requests and limits for your pods based on historical usage patterns.
VPA has three main components:
Recommender: It analyzes historical and current resource usage to provide recommendations.
Updater: It automatically updates the resource requests and limits for pods.
Admission Controller: It sets the initial resource requests and limits for new pods based on recommendations.
VPA is useful in scenarios where workloads have unpredictable or variable resource requirements. For example, applications that experience fluctuating traffic or perform batch-processing tasks can benefit from VPA's ability to adjust resources dynamically. By analyzing past and present resource usage, VPA recommends optimal resource allocations.
Moreover, VPA aids in cost optimization by preventing over-provisioning. Instead of allocating excessive resources "just in case," VPA ensures that pods receive only what they need, reducing unnecessary expenses. But generally, VPA is not a great fit for dynamic production environments because of the following limitations:
Despite its advantages, VPA has limitations that you should be aware of:
Before using VPA, first, ensure that your Kubernetes cluster is running version 1.11 or later. After that, you'll need to have the Metrics Server installed and configured in your cluster, as VPA relies on it for gathering resource utilization data.
Deploy Metrics Server:
kubectl apply -f https://github.com/kubernetes-sigs/metrics-server/releases/latest/download/components.yamlVPA is not part of the standard Kubernetes distribution and needs to be installed separately. Then you can deploy it using the manifests provided in the Kubernetes autoscaler repository.
git clone https://github.com/kubernetes/autoscaler.git
cd autoscaler/vertical-pod-autoscaler
git checkout origin/vpa-release-1.0
./hack/vpa-up.sh
This script will deploy the necessary components, including the VPA Admission Controller, Recommender, and Updater.
vpa-admission-controller-7467db745-kbhhc   1/1     Running
vpa-recommender-597b7c765d-4sm2m           1/1     Running
vpa-updater-884d4d7d9-qk97b                1/1     Running
Once VPA is installed, you need to create VPA objects for the deployments you want to autoscale.
apiVersion: autoscaling.k8s.io/v1
kind: VerticalPodAutoscaler
metadata:
  name: my-vpa
spec:
  targetRef:
    apiVersion: "apps/v1"
    kind: Deployment
    name: my-app
  updatePolicy:
    updateMode: "Auto"
  resourcePolicy:
    containerPolicies:
    - containerName: '*'
      minAllowed:
        cpu: 100m
        memory: 50Mi
      maxAllowed:
        cpu: 1
        memory: 500Mi
      controlledResources: ["cpu", "memory"]
This YAML defines a VPA object that targets a deployment named "my-app" and operates in "Auto" mode. It also specifies minimum and maximum resource limits to prevent extreme scaling decisions.
Cluster Autoscaler (CA) automatically adjusts the number of nodes in your Kubernetes cluster based on actual workload demand- making the link to actual cost savings.
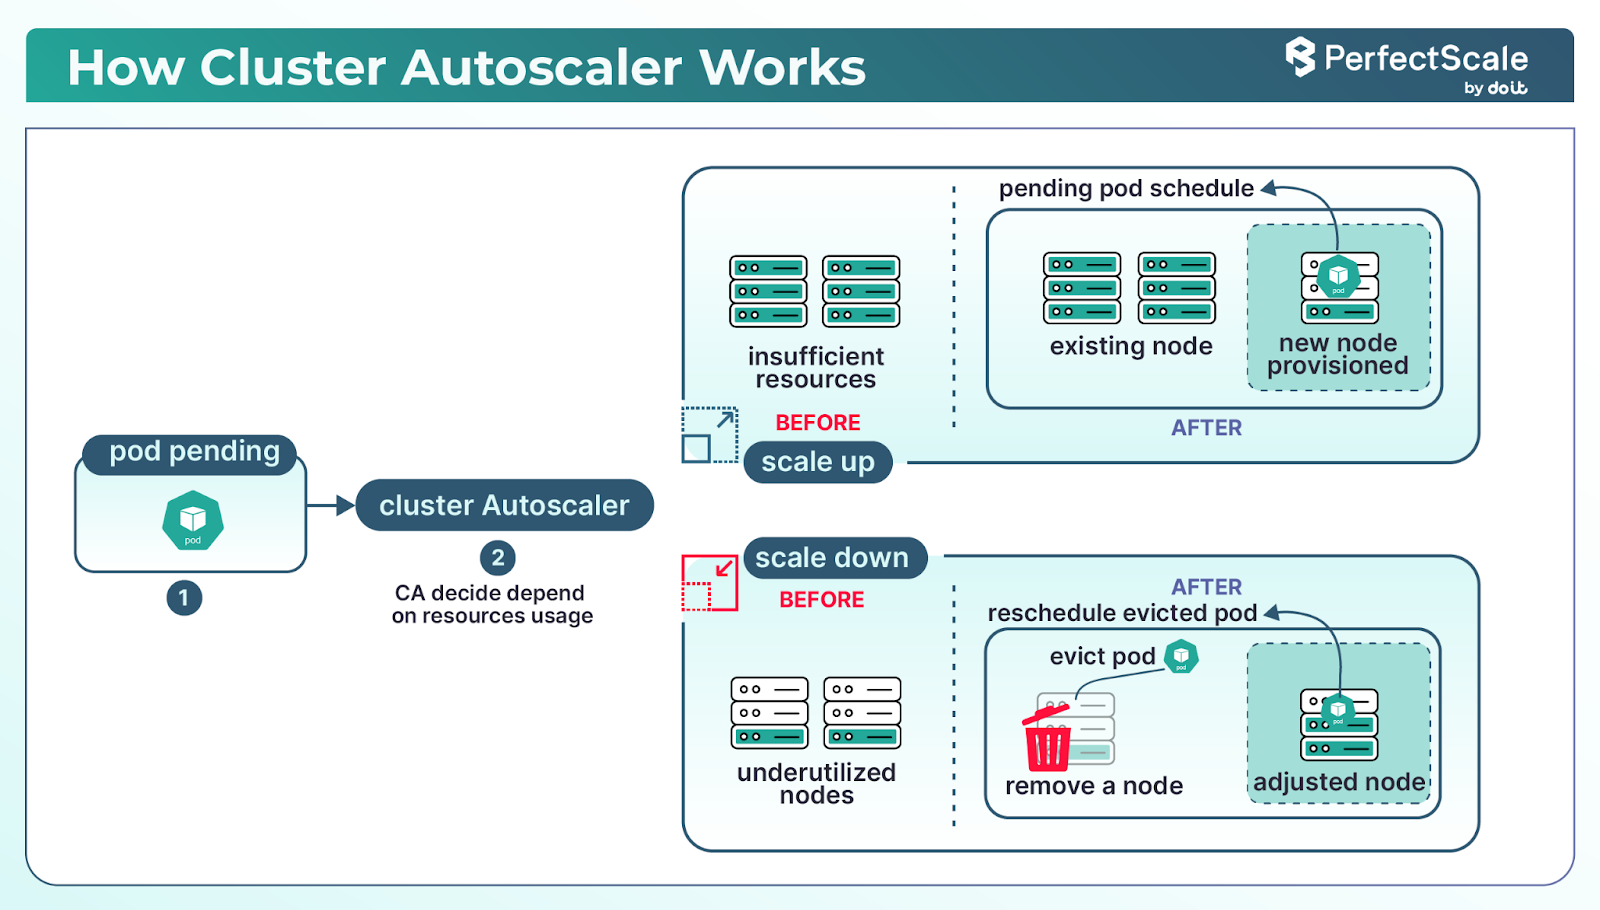
Without CA, pods may scale, but nodes do not, your bill remains unchanged. CA enables true pay‑for‑usage, aligning infrastructure spend with actual demand.
Deploying and managing the Cluster Autoscaler (CA) can be easy using Helm charts. The official K8s Cluster Autoscaler Helm chart, maintained in the Kubernetes autoscaler repository, offers a flexible way to deploy CA in your Kubernetes clusters.
Deploying the K8s Cluster Autoscaler:
To deploy the CA using this Helm chart, you generally follow these steps:
1. Add the autoscaler Helm repository:
helm repo add autoscaler https://kubernetes.github.io/autoscaler2. Update your Helm repositories:
helm repo update3. Install the chart with custom values:
helm install cluster-autoscaler autoscaler/cluster-autoscaler \
    --namespace kube-system \
    --set autoDiscovery.clusterName=<your-cluster-name> \
    --set awsRegion=<your-aws-region>
Depending on your cloud provider (AWS, GCP, Azure), you'll need to set specific values. For example, in AWS, you might need to configure autoDiscovery.clusterName and awsRegion.
Best Practices:
For more information on the helm charts of CA, see here.
CA is just one option in a broader autoscaling ecosystem. Let’s explore modern alternatives to help you make the best choice:
A newer, more dynamic autoscaler built to provision right-sized nodes automatically. Instead of relying on pre-defined node groups, it directly picks the best instance type for each pod requirement. Karpenter launches nodes faster (under a minute) and supports spot-instance optimization, making it ideal for cost-sensitive, high-velocity workloads. Its flexibility reduces manual overhead.
In managed Kubernetes environments like GKE or AKS, NAP brings together CA and dynamic pool creation. When no existing node pool fits a pending pod, NAP can spin up an entirely new pool automatically based on CPU, memory, GPU, or taints, and delete it when it’s idle. This reduces the need for upfront pool planning and simplifies operations. While less customizable than Karpenter, NAP is a smart, managed solution that balances ease and control.
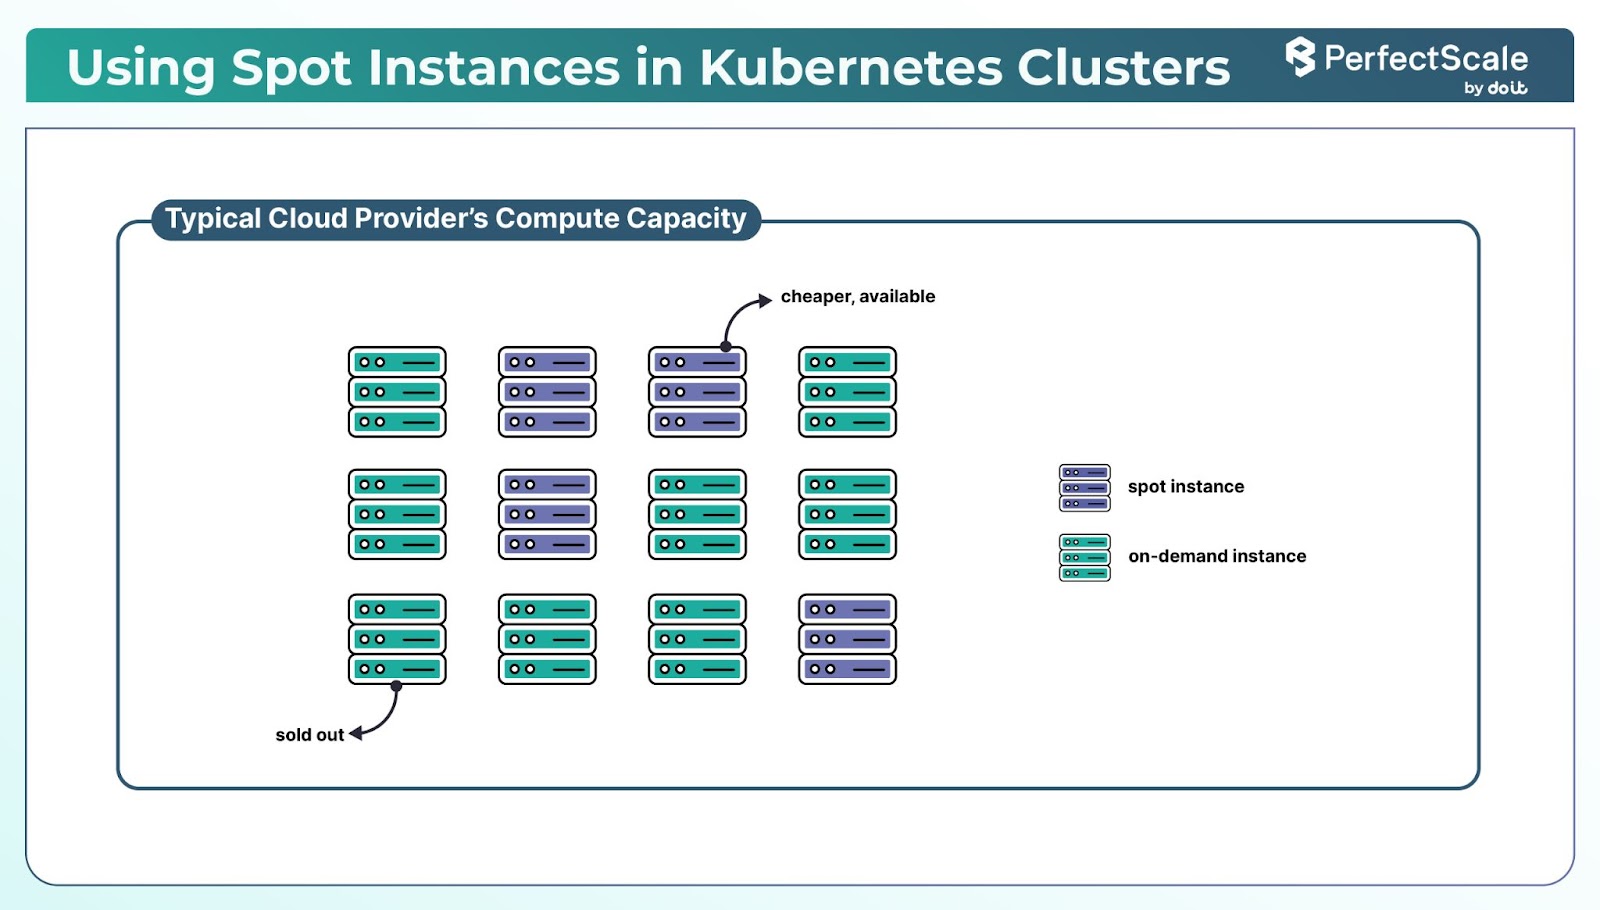
Spot Instances are spare compute capacities offered at significantly reduced prices, often up to 90% less than On-Demand instances.
You should integrate Spot Instances into your Kubernetes clusters, as it can lead to substantial cost savings.
You can assign non-critical workloads to Spot Instances by using node selectors and taints. This ensures that only suitable workloads are scheduled on these instances.
Node Selector Example:
apiVersion: v1
kind: Pod
metadata:
  name: sample-app
spec:
  containers:
  - name: sample-container
    image: nginx
  nodeSelector:
    lifecycle: spot
Taint and Toleration:
First, taint the Spot Instance nodes:
kubectl taint nodes <node-name> spotInstance=true:NoScheduleThen, add a toleration to the pod specification:
apiVersion: v1
kind: Pod
metadata:
  name: sample-app
spec:
  containers:
  - name: sample-container
    image: nginx
  tolerations:
  - key: "spotInstance"
    operator: "Equal"
    value: "true"
    effect: "NoSchedule"
You can use tools like Karpenter, Cluster Autoscaler, etc., which can dynamically provision and manage Spot Instances:
apiVersion: karpenter.sh/v1
kind: NodePool
metadata:
  name: cost-optimized
spec:
  template:
    spec:
      requirements:
        - key: "karpenter.sh/capacity-type"
          operator: In
          values: ["spot"]
  disruption:
    consolidationPolicy: When Underutilized
  limits:
      cpu: "100"
      memory: "200Gi”
This configuration allows spot instances to be used, ensuring flexibility in cost optimization.
Note: Spot Instances can be interrupted with a two-minute warning. To handle this gracefully, Karpenter can be configured to respond to interruption notices by draining pods and provisioning replacement capacity. Ensure that your workloads are stateless or can tolerate interruptions.
In Kubernetes, not all workloads are of equal importance. Some are critical and must always be available, while others are less critical. Kubernetes allows you to assign priorities to pods using PriorityClass, ensuring that critical workloads are scheduled before less critical ones, especially during resource constraints.
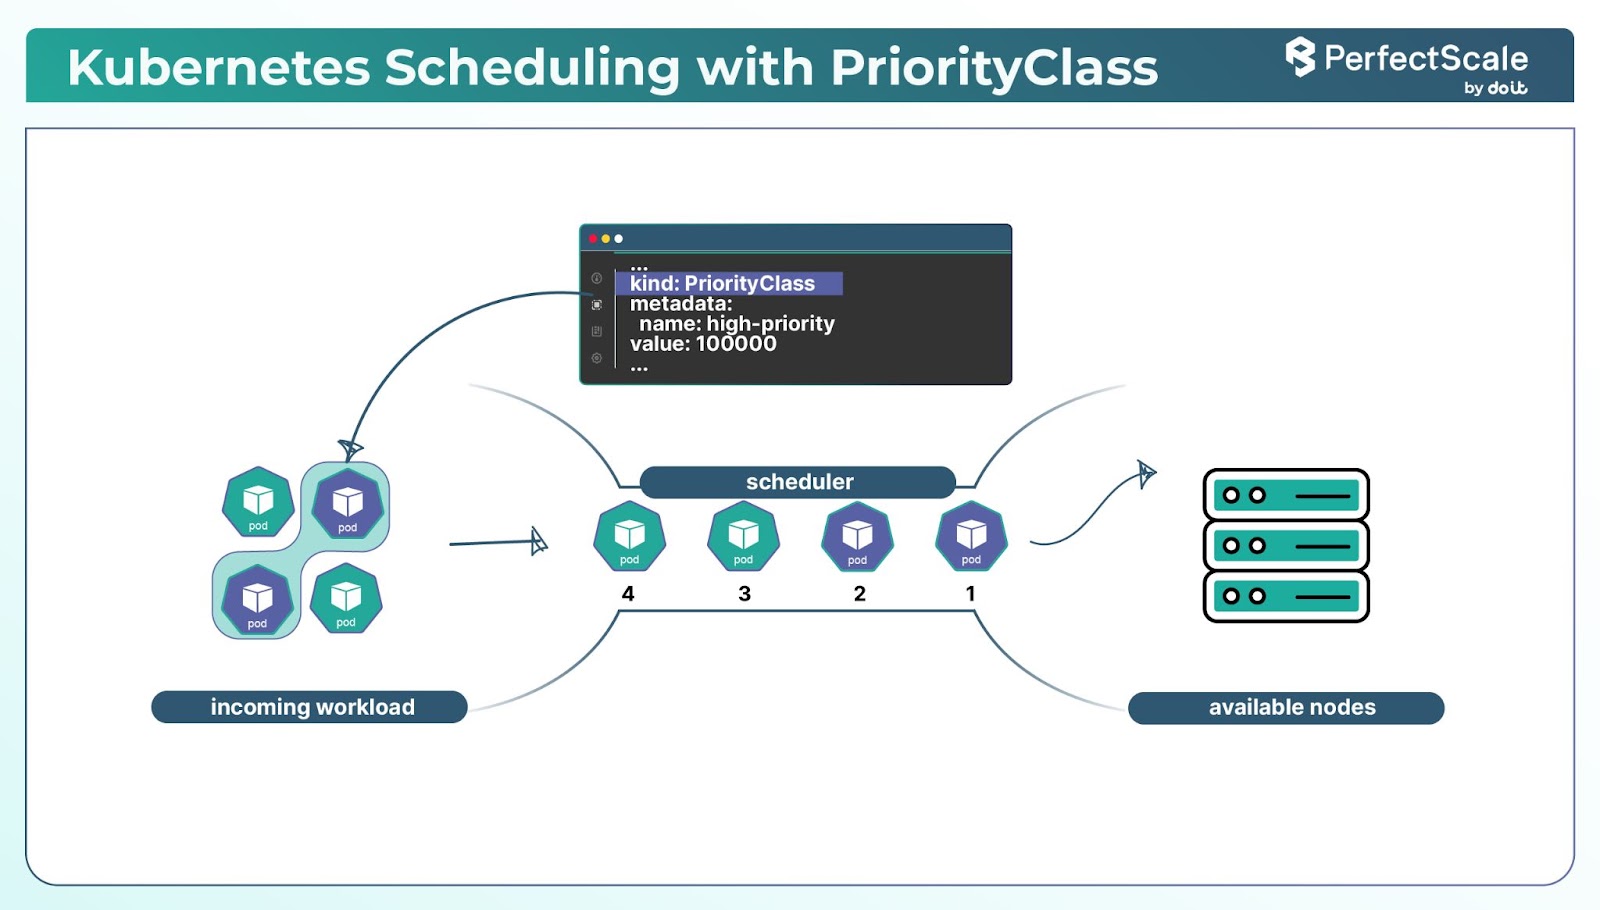
Create PriorityClass resources to assign priority values to different classes of workloads.
apiVersion: scheduling.k8s.io/v1
kind: PriorityClass
metadata:
  name: high-priority
value: 100000
globalDefault: false
description: "This priority class is for critical workloads."
In this configuration, value determines the priority level; higher values indicate higher priority. globalDefault: false means this class isn't the default for pods without a specified priority.
Assign PriorityClass to Pods:
Specify the priorityClassName in your pod or deployment specifications.
apiVersion: v1
kind: Pod
metadata:
  name: critical-app
spec:
  containers:
  - name: critical-container
    image: nginx
  priorityClassName: high-priority
Efficient storage management is a cornerstone of Kubernetes cost optimization. By selecting appropriate storage classes, implementing lifecycle policies, and regularly auditing storage usage, you can reduce unnecessary expenditures.
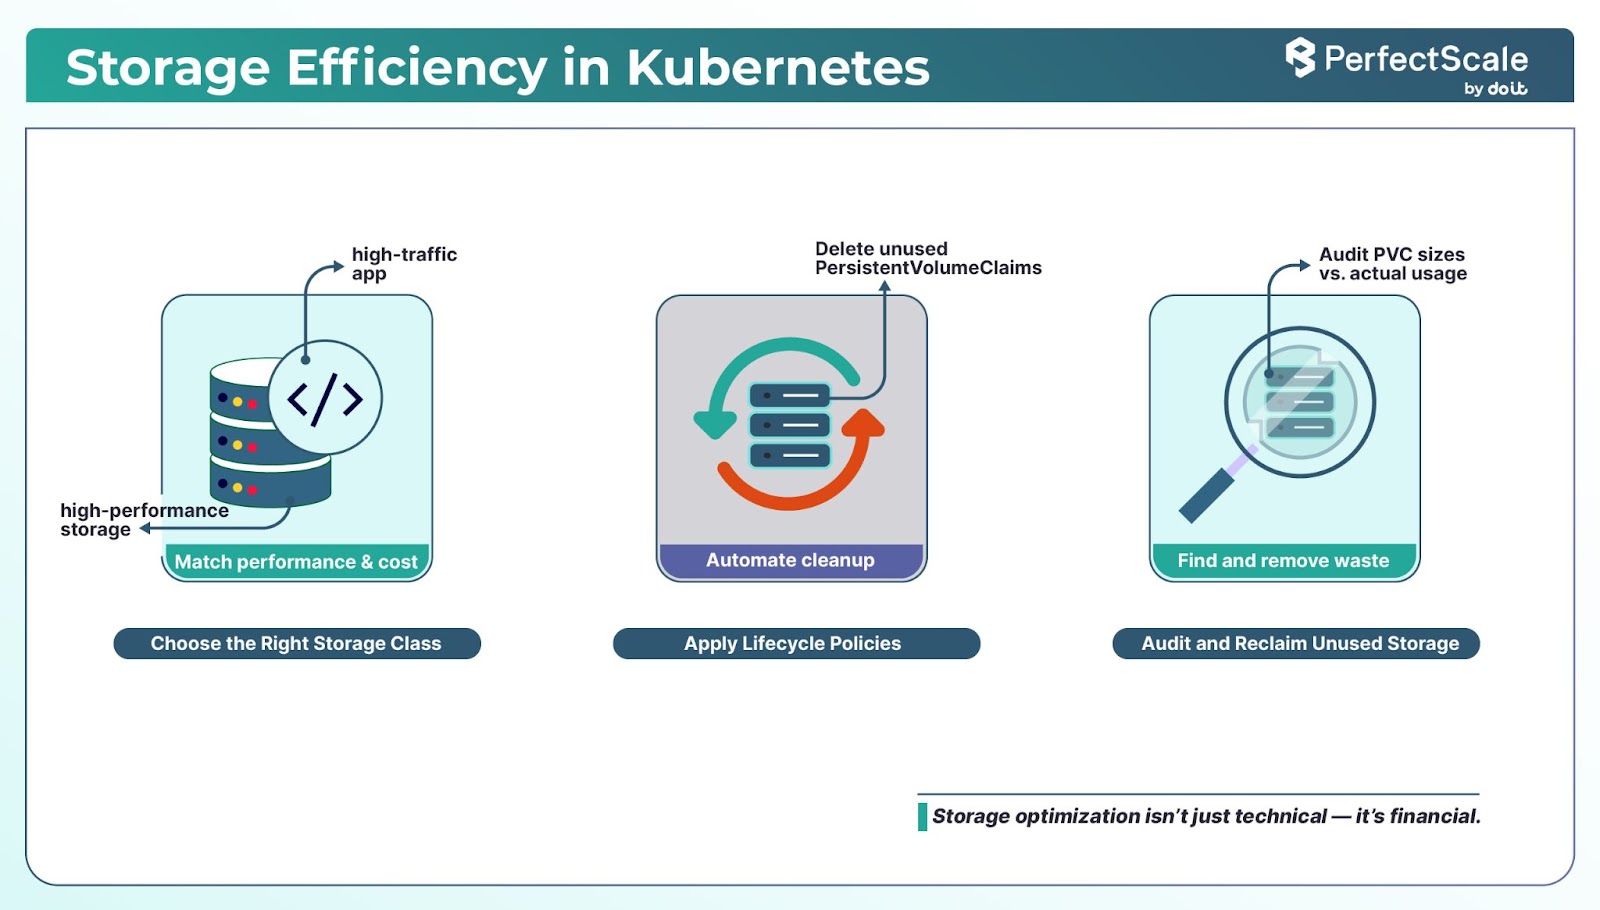
You should begin by defining StorageClass objects tailored to the performance and cost requirements of your workloads. For example, use high-performance SSDs for latency-sensitive applications and standard HDDs for less critical data.
apiVersion: storage.k8s.io/v1
kind: StorageClass
metadata:
  name: standard-hdd
provisioner: kubernetes.io/aws-ebs
parameters:
  type: gp2
  encrypted: "true"
reclaimPolicy: Delete
volumeBindingMode: WaitForFirstConsumer
Also, consider compressing and archiving old data that is infrequently accessed. This not only saves storage space but also reduces costs associated with high-performance storage tiers.
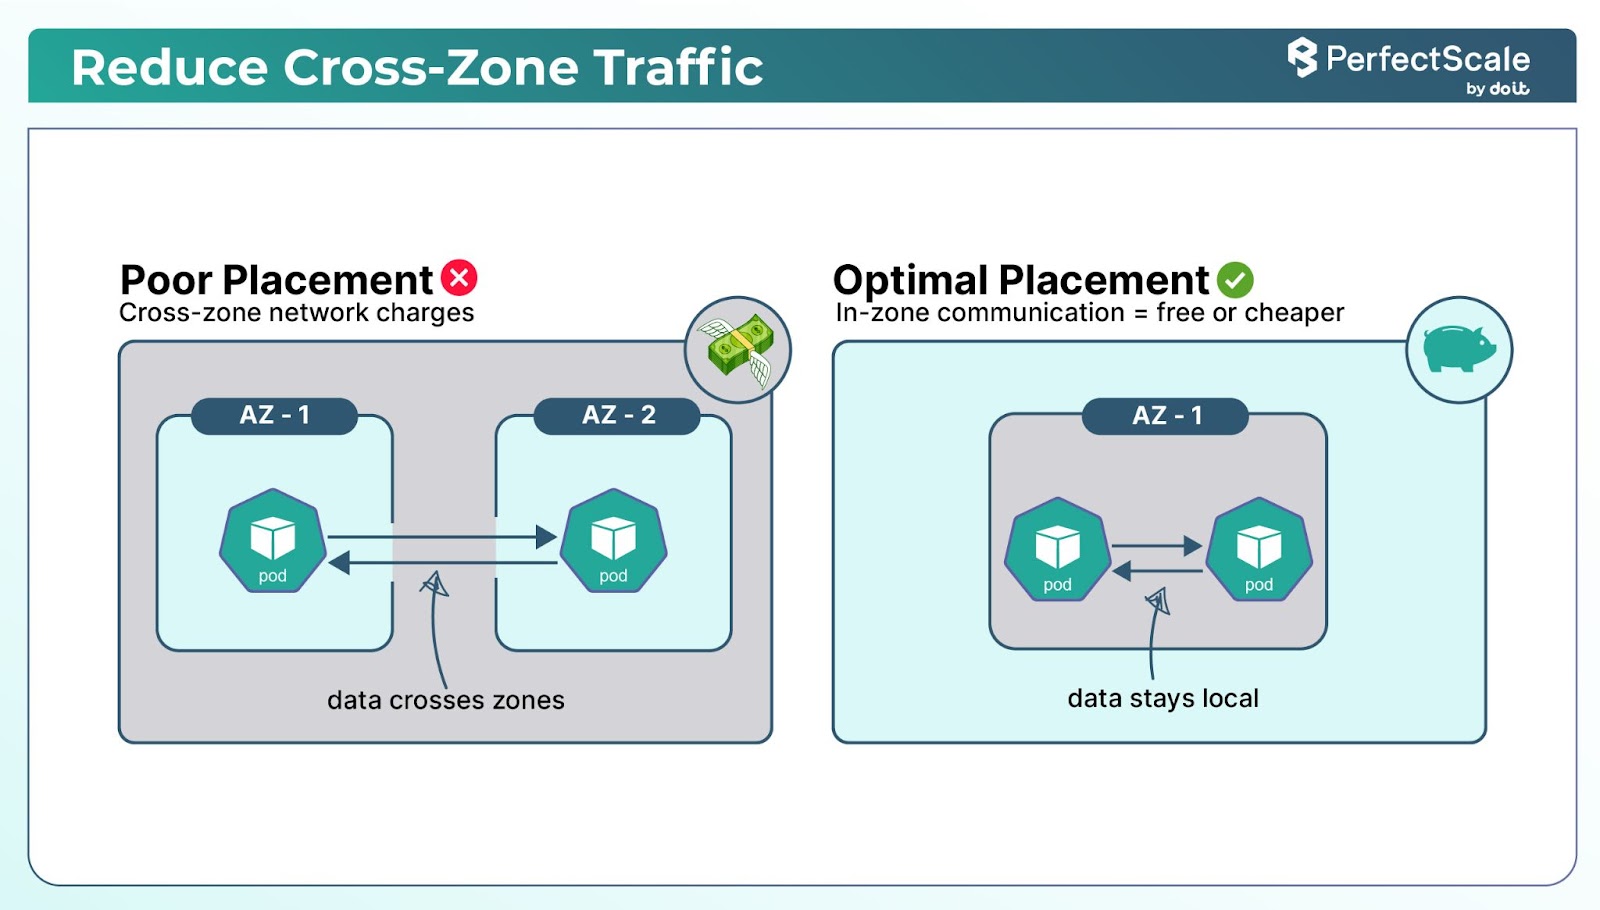
In Kubernetes, reducing cross-zone communication can help save money because sending data between zones can increase cloud costs.
To minimize this, you should schedule Pods that frequently communicate with each other in the same availability zone. Instead of spreading them out across zones, placing them in one zone reduces the need for traffic to cross zones.
apiVersion: apps/v1
kind: Deployment
metadata:
  name: example-deployment
spec:
  replicas: 6
  selector:
    matchLabels:
      app: example
  template:
    metadata:
      labels:
        app: example
    spec:
      nodeSelector:
        topology.kubernetes.io/zone: us-east-1a
      containers:
      - name: example-container
        image: nginx
This setup ensures that all Pods run in the us-east-1a zone. For more flexible and fault-tolerant distribution, consider using Topology Spread Constraints instead of hardcoding zone affinity.
You should organize resources using namespaces in Kubernetes helps in better resource allocation, access control, and cost tracking. By assigning resources to specific namespaces, teams can manage their workloads independently, and administrators can monitor and allocate costs more effectively.
Create distinct namespaces for different teams or projects. Assign resource quotas and limitRanges to each namespace to control resource consumption:
apiVersion: v1
kind: Namespace
metadata:
  name: team-alpha
  labels:
    team: alpha
    environment: production
apiVersion: v1
kind: ResourceQuota
metadata:
name: team-alpha-quota
namespace: team-alpha
spec:
hard:
requests.cpu: "10"
requests.memory: 20Gi
limits.cpu: "20"
limits.memory: 40Gi
Manual optimization involves human-led tuning of your Kubernetes environment—from replicas and node pools to requests, limits, scheduling rules, and governance policies. While technically possible, it introduces significant drawbacks:
Manual optimization might work for dev/test environments or small, stable workloads, but it’s inefficient and risky in production environments.
Automation is not just a convenience - it’s a strategic necessity for achieving the cost, reliability, and scalability goals. Automated systems proactively monitor workloads, dynamically adjust compute at both pod and node layers (e.g., HPA, VPA, Cluster Autoscaler, Karpenter), and enforce policies consistently across environments.
These tools react in milliseconds, not in hours, and ensure workloads hit performance targets without delay, while continuously rightsizing based on actual utilization. The result: cloud costs decrease, latency drops, and your SREs can focus on architecture instead of firefighting. Automation scales seamlessly across clusters, clouds, and regions, preventing manual efforts of manual management as your infrastructure grows.
However, automation isn’t a silver bullet; it adds its own risks if uncontrolled. Overly aggressive scaling or misconfigured thresholds can trigger rapid scale-in events and, in extreme cases, even unintentionally amplify denial-of-sustainability attacks like the YoYo auto‑scale exploit. Blind automation may remove the essential buffer your systems need to handle rare traffic spikes, pushing clusters toward instability.
The YoYo attack (Bremler-Barr et al., 2017) operates against the auto-scaling mechanism of VMs in the cloud. The periodic bursts of traffic loads cause the auto-scaling mechanism to oscillate between scale-up and scale-down phases. The auto-scaling mechanism translates the flat DDoS attacks into Economic Denial of Sustainability attacks (EDoS), where the victim suffers from economic damage accrued by paying for extra resources required to process the traffic generated by the attacker. Additionally, it was shown that the YoYo attack also causes significant performance degradation since it takes time to scale up VMs.
To guard against these pitfalls, it's wise to put a few safety checks in place:
These help ensure your automation only acts on healthy, ready-to-serve pods. If a pod fails its probe, it won’t be counted as ready, so your autoscaler won’t scale based on it. That keeps unstable pods from being included in scaling decisions.
PDBs let you set limits on how many pods can be taken down (either by scale-in or by planned disruptions) at once. This prevents your automation from shrinking capacity too aggressively and helps maintain enough running pods to absorb unexpected traffic.
By adding these guardrails, you give your automation a way to fail gracefully instead of blasting off and pushing your system into danger.
PerfectScale takes the burden of Kubernetes cost optmization off the DevOps, Platform,SRE, and Finops teams, allowing them to focus on bigger, more important projects. Your K8s environment will continuously be perfectly scaled, with lower cloud costs, reduced SLA/SLO breaches, fewer outages and downtimes, and a more reliable and stable overall experience for users.
PerfectScale can be implemented in minutes and starts providing instant results. Book a demo today and find out how PerfectScale can help you lower your Kubernetes costs while putting system uptime and resilience first.
Kubernetes cost optimization is the practice of reducing cloud spend by right-sizing CPU/memory, autoscaling pods and nodes together, choosing cost-effective storage/networking, and enforcing governance so clusters meet SLOs without paying for idle capacity.
Start by right-sizing high-spend workloads (use p95 usage), remove CPU limits where safe to improve bin-packing, pair HPA with Cluster Autoscaler or Karpenter so nodes scale down, move tolerant workloads to Spot, and eliminate cross-zone traffic for chatty services.
PerfectScale (autonomous rightsizing + risk), Kubecost (cost visibility), CAST AI (automated infra), CloudZero (cost intelligence), ScaleOps (resource automation).
Use HPA to change replica counts for variable traffic; pair with CA/Karpenter to affect node count (and cost). Use VPA for stable/batchy workloads to tune requests/limits; avoid conflicting metrics if combining with HPA.
CA is mature and multi-cloud but slower, tied to node groups. Karpenter launches right-sized nodes fast and excels with Spot on AWS. NAP (managed providers) creates/deletes pools on demand with less config but less flexibility. Pick based on cloud, speed needs, and ops model.
Cross-zone data transfer, abandoned PVs/snapshots, over-requested memory (drives bigger nodes), always-on LBs/ingress, and overly aggressive log/metrics retention.


Install in minutes and instantly receive actionable intelligence.

.png)

.png)