Subscribe to our newsletter
Thank you! Your submission has been received!
Oops! Something went wrong while submitting the form.

.png)
AWS S3 throttling refers to the intentional rate-limiting of requests made to Amazon Simple Storage Service (S3) by AWS to ensure fair use of resources and maintain performance stability across the service. Throttling is typically encountered when a user or application exceeds the request rate limits set by AWS for S3 operations.
Amazon S3 (Simple Storage Service) is a widely used cloud storage service that offers scalable storage to businesses and individuals alike. It’s fair to say most who work with data in any capacity have probably encountered Amazon S3. The Amazon Simple Storage Service – represented by the three S’s – is a popular cloud storage service that offers scalable storage to businesses and individuals alike. But as often happens when dealing with a large amount of data, using such a service for a business comes with its own set of challenges.
One of them we will be taking on in this article – namely, managing throttling. We will explore the issue of AWS S3 throttling, sharing with you an example of a specific problem we encountered working with S3 at PerfectScale by DoiT, and how we dealt with it.

Amazon S3 (Simple Storage Service) is a widely used cloud storage service that offers scalable storage to businesses and individuals alike. It’s fair to say most who work with data in any capacity have probably encountered Amazon S3. The Amazon Simple Storage Service – represented by the three S’s – is a popular cloud storage service that offers scalable storage to businesses and individuals alike. But as often happens when dealing with a large amount of data, using such a service for a business comes with its own set of challenges. One of them we will be taking on in this article – namely, managing throttling. We will explore the issue of throttling regarding S3 usage, sharing with you an example of a specific problem we encountered working with S3 at PerfectScale, and how we dealt with it.
Before diving into the details, let's first understand what S3 throttling limits are. Throttling is a mechanism by Amazon to limit the amount of data traffic allowed for each S3 bucket or object. These limits are designed to ensure fairness among users and prevent abuse of the S3 service.
So what does that mean for your data storing process? When a bucket or object reaches its rate limit, AWS will start limiting the number of requests or the data transfer rate. This can result in slower response times, increased latency, and overall degraded performance for your applications or data pipelines.
Now that we understand the impact, let's explore the factors that contribute to AWS S3 throttling. The main factors include:

Now that we clearly understand S3 throttling and its significance, let's dive into the best practices for managing it effectively.
Like many organizations, we store data in S3. Namely, we store a lot of data about processes and nodes from customers’ Kubernetes clusters and we do analysis and compute recommendations from this. Early in the development phase of our product, we had to decide on what format to store our data in. After some research, we landed on something relatively universal:
<common_prefix>/<client_id>/<year>/<month>/<day>/<time>
We also created some additional, complementary objects alongside our schema, which we use for consistency and augmentation of data when retrieving it for customers.
Because this is a critical data store for us, after some time we decided to improve reliability around S3. The major advantage of the S3 storage service is its huge durability. As satisfying as those features were in most cases, we added additional protection - by copying the bucket into a standby bucket. Even though many built-in features exist to aid in building such a standby solution, we opted to make our own, as we wanted to be able to use a bit of custom logic to better suit our data’s specific needs. For this, after running benchmarks, we decided to go with RClone which is a very good fit, satisfying all our requirements.
Running our backup and switchover procedure in a preproduction environment made us confident that we had made a good choice, so we decided to proceed with rolling it out to production. After turning it on, however, we saw a sudden spike in SlowDown responses from AWS, which was so impactful that we had to turn the new service off.
Although SlowDowns are a well-documented behavior of the S3 bucket, we were still clueless as to why it happened, since our prefixes schema should’ve allowed us much greater RPS than we observed.
We decided that our understanding of throttling in S3 was not good enough, and we needed to double-check the areas where our assumptions were not matching up with what we had observed.
Right after this incident, we added detailed filters on prefixes we thought were hitting s3 limits and we found that the RPS limit was not at the level we thought it was.
We reached out to support and got some suggestions on how to reduce the load on the S3 bucket. They proved to be quite useful, but we still wanted to get to the bottom of the problem – why do we get to 3.500 RPS combined for all prefixes?
In our research, we also found some notions claiming prefixes are not partitions and that AWS will increase RPS limits whenever it gets a high load over a specific period.
We were not sure if we should leave our static first part of the prefix where it is, or move the prefix of the object down and if a partition would happen.
We decided to implement and run a benchmark to ultimately make this decision.
In our case, we had to answer one important question regarding how we organize objects in store:
<common_prefix>/<client_id>/<year>/<month>/<day>/<time>
or
<client_id>/<year>/<month>/<day>/<time>
If AWS S3 increases RPS by the variability of the lower part then we should remove common_prefix.
As a non-primary goal, we wanted to know how it partitions data after load and see if maybe we had missed something else along the road.
We decided to proceed with the following:
After defining our goal, we had to choose our tool for running a benchmark. We knew we wanted a couple of things:
We opted for K6 which gives it all and exposes metrics in Prometheus format. The bonus for us was that we had experience using this tool.
We used the K6 operator to execute a benchmark in our k8s cluster with the following CRD, to provide enough parallelism so that we can reach the 10.000 RPS limit. We created a separate service account with the attached role arn from AWS to follow our security model.
CRD
We created the following test case to write data into the target:
We ran into a bit of a problem using the default metrics, since they stored the whole URL towards the object, exploding the number of metrics in Prometheus. This led to a huge latency for Prometheus. We overcame this with delete statement for url tag.
Another issue came with using IRSA - our approach does not refresh tokens, so the test was limited to sts token duration (which was good enough for us to answer our question).
You can check the whole repository with test cases yourself, it lacks a pod setup, and for that, you need to attach IRSA for the pod with access to your bucketname.
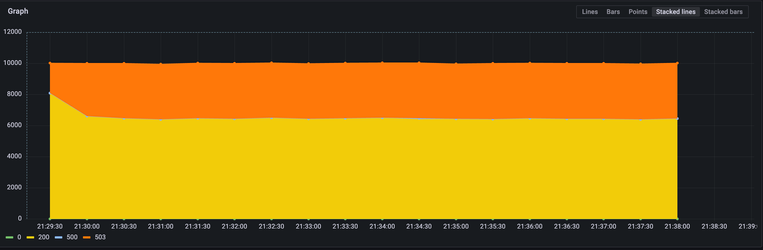
In the following section there will be references to a cold and hot start - by cold start, it means that the prefix of this object has not been used before, thus AWS will not apply any partitioning rules to it. By hot - it means that there has been a previous load to this prefix.
The following chart shows the benchmark run metrics with the common prefix during a cold start:
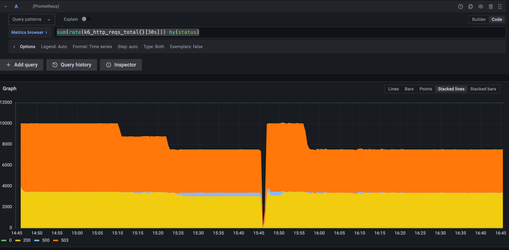
The yellow color shows the rate per second with a 200 response status code, 503 is a slowdown, and 500 is an internal status error. As you can see, the chart is stacked, and at the start, we were able to produce 10.000 RPS in total.
You can notice the staircase pattern in decreasing RPS that the benchmark generates.
The following chart shows the benchmark run metrics without a common prefix during a cold start:
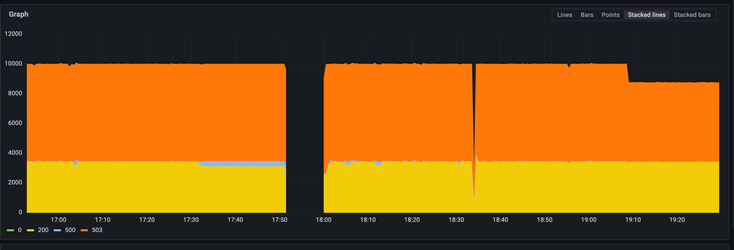
After a couple of hours we repeated the tests using the same client_id values (hitting the same prefixes).
The following chart shows the benchmark run metrics with a common prefix during a hot start:
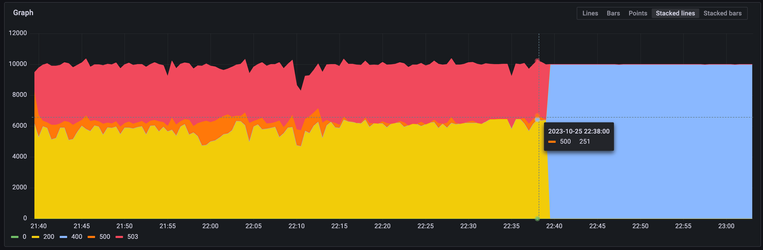
In this graph, yellow is the 200 status code, orange is 500 - which is the internal status code, red is a slowdown, and blue - is the authorization error. In this chart, we ran into a JWT expiration.
In the end, we decided there was no need to change the schema, but it was interesting to see a partitioning taking place after a big load. We’ve noticed there is a peculiar coarse pattern when using common prefixes after the S3 partition prefix, as well as a higher chance of an internal server error.
The following chart shows the benchmark run metrics without a common prefix hot start
So, what did we learn from this experiment?
Use prefixes for your objects, this will be a guardrail for AWS to partition it. Even if you have prefixes it doesn’t mean that AWS will give you 3.500 RPS for every prefix, extended load for them causes partitioning and thus increased throughput.
Keep in mind that it is recommended to have a shared part of the object name in the prefix since S3 won’t partition based solely on the object name.
Having common prefixes is okay and their location does not impact a partition.
Hitting 503 is okay as long as you have retry policies, keep monitoring and you will see they are decreasing over time as S3 partition data.
Optimizing your Amazon S3 usage requires a clear understanding of throttling as well as having some effective management strategies. By utilizing the experiments we’ve shared in this guide, you can improve the performance of your data storage service, minimize the risk of throttling, and reduce costs associated with exceeding the free tier limits.
Remember to continuously monitor your S3 usage and adjust your strategies as needed to adapt to changing requirements. By staying proactive and implementing the right practices, you can make the most out of Amazon S3 and maximize the benefits it offers for your storage needs.
Using EKS to run workload that leverage S3? PerfectScale is your go-to solution for managing cloud costs effectively without compromising on performance. With our cutting-edge algorithms, PerfectScale ensures your services are precisely resourced to handle demand while keeping expenses minimal. Our platform specializes in Kubernetes cost optimization, automatically adjusting your resources to fit your needs, saving you time and money.
Say goodbye to manual adjustments and hello to a more stable, reliable, and cost-efficient cloud environment. Join industry leaders like Paramount Pictures and Salesforce who trust PerfectScale for their Kubernetes management. Sign up or Book a demo with the PerfectScale team today!


Install in minutes and instantly receive actionable intelligence.
.png)


.png)