
▶️ On-Demand Kubernetes Excellence Workshop
Operating Kubernetes Multi-tenancy: Shared Cluster, Separate Headaches
Welcome to the workshop!
TL;DR
In a shared Kubernetes cluster, one tenant using far more than it requested can OOM-kill or CPU-throttle its neighbors, and kubectl will show you the symptom without the cause. The webinar walked through a three-part fix: diagnose noisy neighbors with the open-source kubectl noisy-neighbors plugin, remediate them automatically with PerfectScale rightsizing at the pod and node layer, then attribute the cost of shared resources (databases, network, LLM endpoints) back to the tenants that actually consumed them with Attribute's eBPF-based sensor. The primitives apply whether you isolate by namespace, node pool, or cluster (multitenancy best practices cover the trade-offs between each).
What was covered
- Why kubectl shows the state, not the consequence
- Naming the aggressor: the noisy-neighbors kubectl plugin
- What good looks like: 70–80% utilization with headroom
- Remediating at the pod layer: waste and resiliency
- Remediating at the node layer: unevictable pods and Karpenter policy
- Who pays for what: attributing shared resources per tenant
- How eBPF makes per-tenant cost attribution possible
- Try it yourself: repo, lab, and free tier
Why kubectl shows the state, not the consequence
Vikram opened on a live cluster in K9s. A search pod had been OOMKilled and restarted 137 times over twelve hours. Every other pod on the node reported Running. Logs showed it was serving traffic. Nothing in kubectl describe or the pod's own metrics explained why it kept dying.
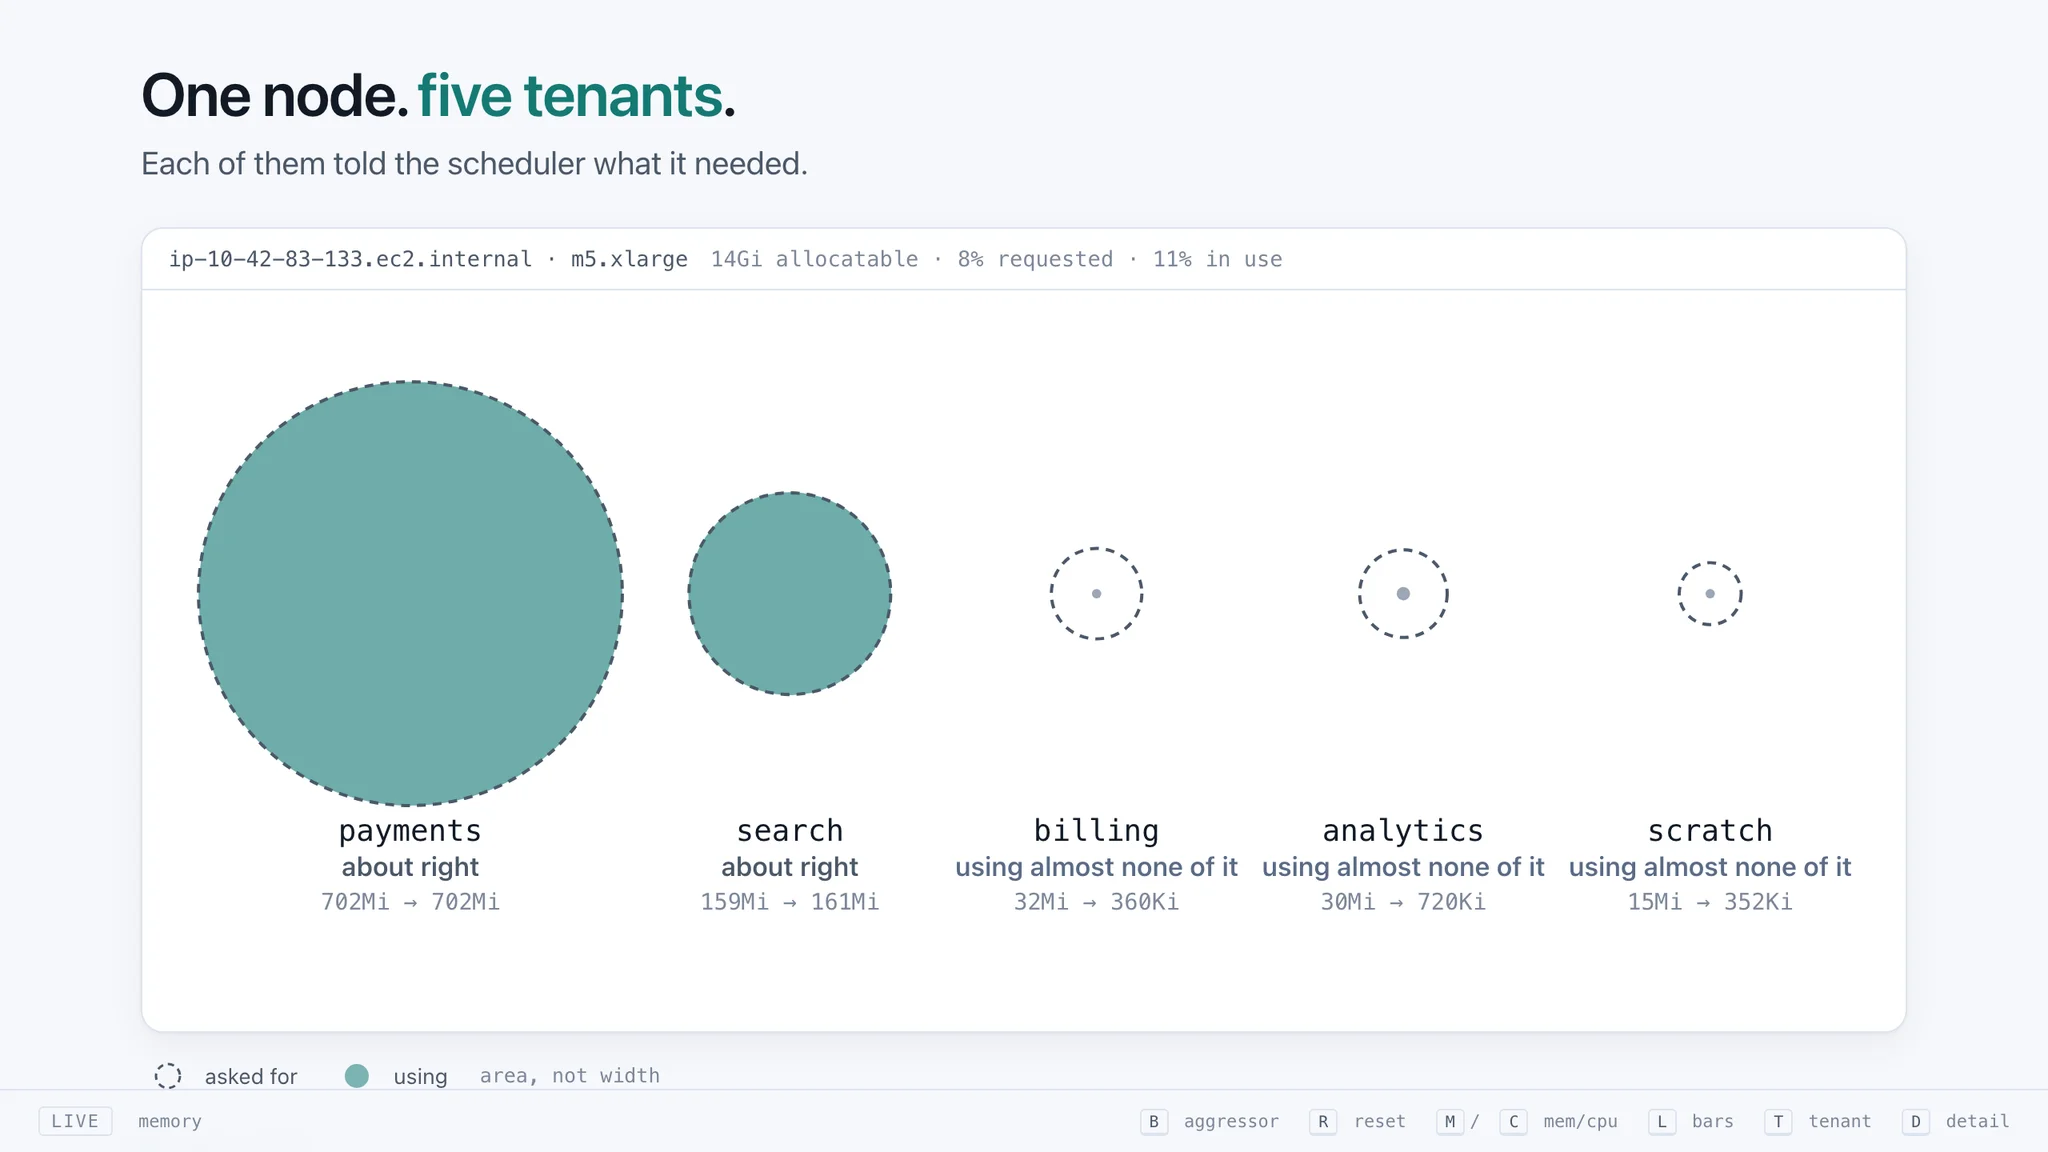
The reason was on the same node. A payments pod had requested a small amount of memory and CPU and was using roughly eleven times that. The scheduler had bin-packed four other tenants around a request that was never true. billing was being CPU-throttled in every CFS period while reporting zero restarts. analytics had requested 2Gi across two pods and was using almost nothing, stranding capacity nobody else could schedule into.
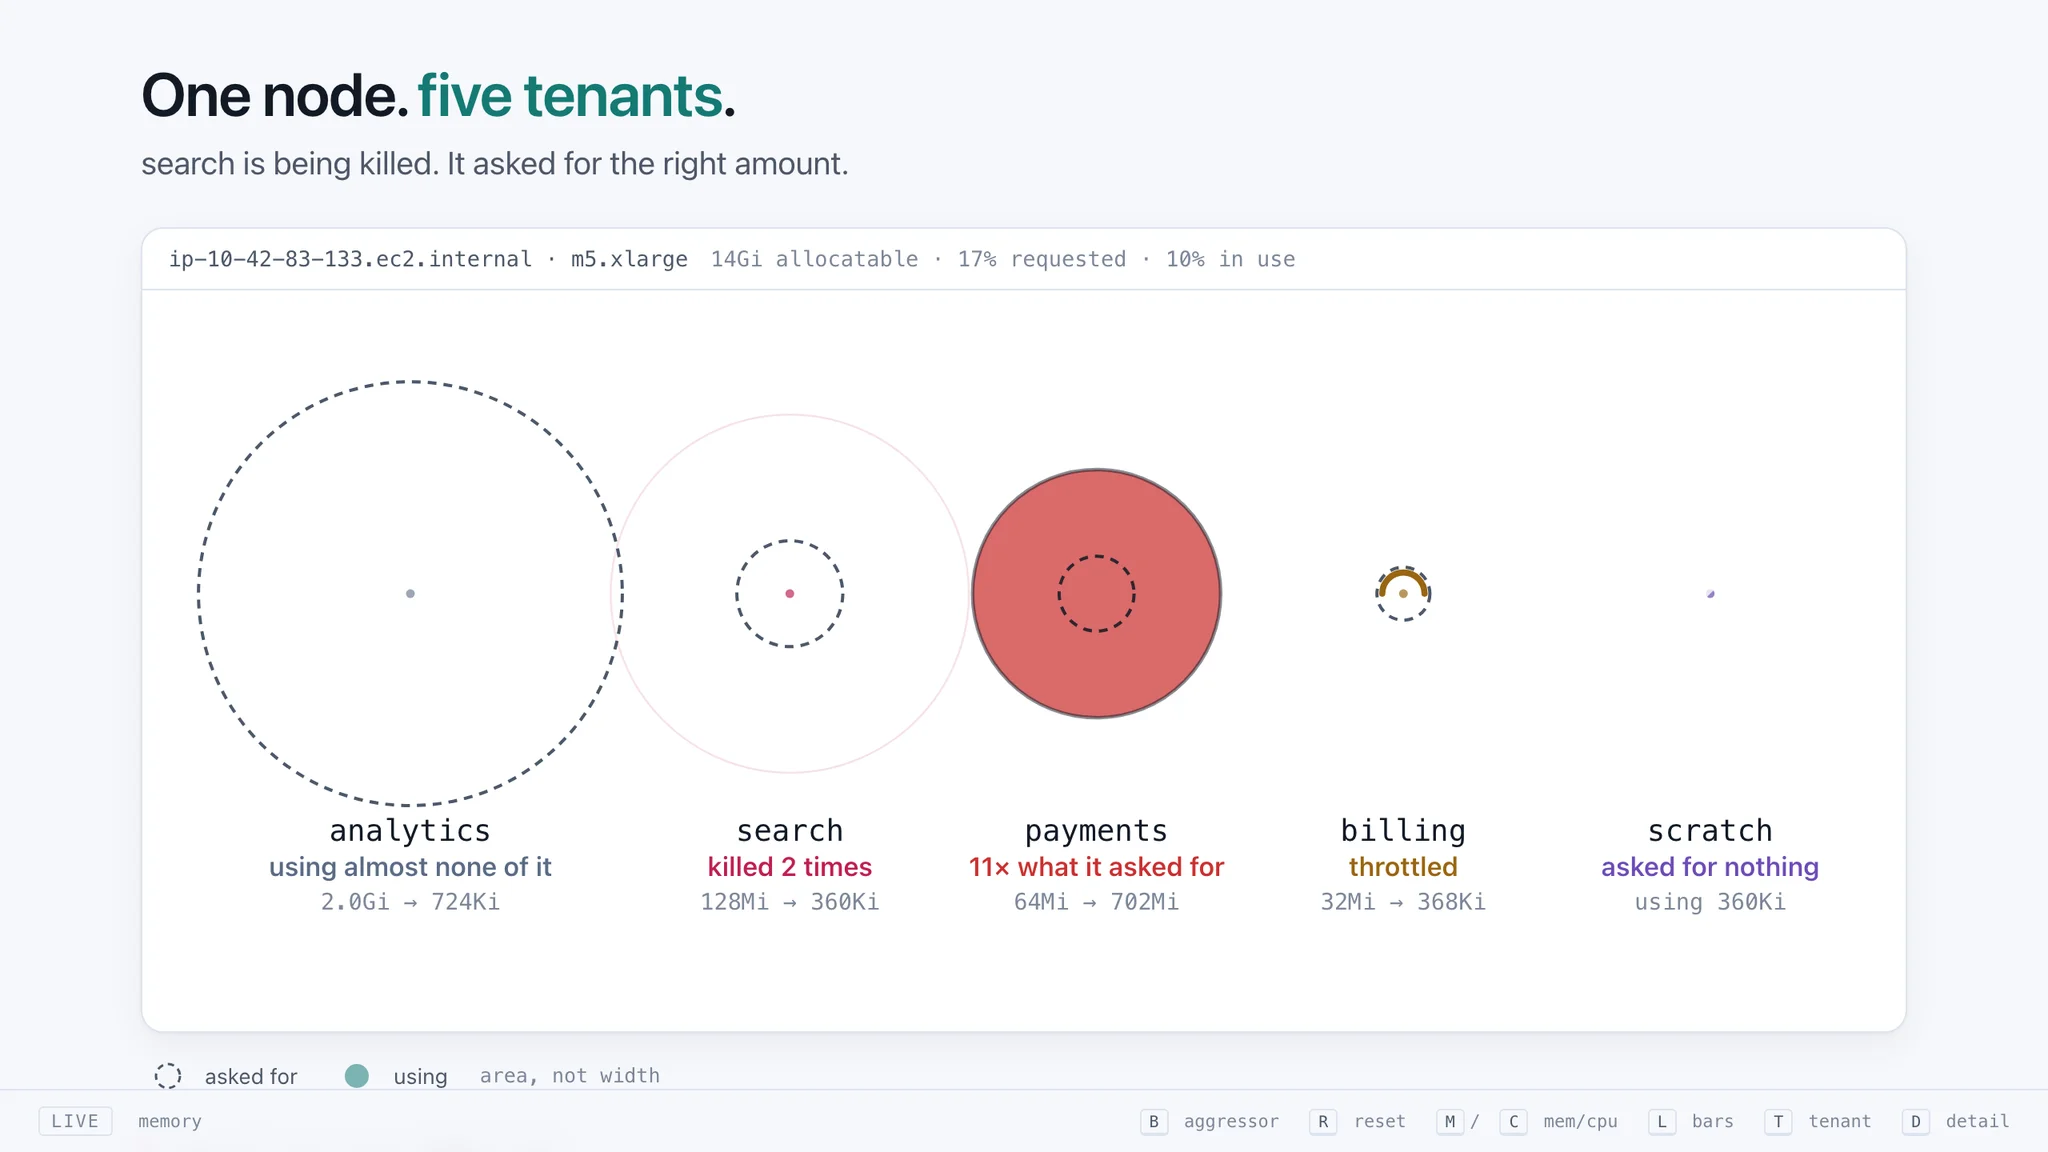
That is the noisy neighbor problem in one node: an aggressor over-consuming relative to its request, victims exposed to it, and an over-requester wasting the headroom that would have absorbed the burst. None of it is visible from the victim's point of view, which is where most on-call investigations start.
Naming the aggressor: the noisy-neighbors kubectl plugin
To make the relationship visible, PerfectScale open-sourced kubectl noisy-neighbors (Apache 2.0). It is a single read-only binary with no Prometheus dependency, no agent, and no CRDs. It reads data the cluster already has, in three tiers:
| Tier | Source | Needs | Adds |
|---|---|---|---|
| 0 | kube-apiserver | read-only ClusterRole | co-tenancy, overcommit, OOMKills, QoS, quotas, scheduling events |
| 1 | metrics.k8s.io | metrics-server | usage vs requests: aggressors, stranded capacity, real saturation |
| 2 | kubelet via nodes/proxy |
get on nodes/proxy |
CFS throttling, OOM counters, per-pod network |
Only tier 0 is required. The report lists every source it used and anything it could not measure, and never fills a gap with an estimate.
A full scan takes about 30 seconds because CPU throttling is a counter; the tool takes two samples and reports the rate between them. Output is a per-node blast radius that names each aggressor and each exposed tenant on the same node:
CRITICAL noisy-lab-worker  5 tenants
    aggressor team-payments/ingest   memory req 64.0Mi, using 701.9Mi (1097% of request)
    aggressor team-payments/ingest   cpu req 50m, using 999m (1998% of request)
    exposed   team-billing/worker    CPU throttled in 100% of periods over the sample window
    exposed   team-search/api        OOMKilled 2m ago (4 restarts); shares this node with 4 other tenants
It also reports whether ResourceQuotas and LimitRanges are actually doing anything, which matters in multi-tenant clusters where quotas are often set once and never revisited.
Useful flags: --namespaces to scope a scan, -o markdown for a shareable report, -o json for pipelines or agents, and --exit-code to fail a CI job on warnings or criticals. Thresholds for aggressor ratio, strand ratio, saturation, and throttle percentage are all tunable.
How it differs from adjacent tools:
| Tool | View |
|---|---|
| KRR, Goldilocks | per-workload rightsizing recommendations |
| kube-capacity | per-node requests vs limits vs utilization |
| OpenCost | per-namespace cost |
| noisy-neighbors | per-node aggressor → exposed-tenant relationships |
What it deliberately does not do: remediate, prove causation (findings say "exposed to", never "killed by"), or keep history. It ends at a diagnosis.
What good looks like: 70–80% utilization with headroom
The target Vikram put forward is not 100% utilization. Bursts and traffic spikes are normal, so you always want a buffer. A healthy multi-tenant node runs at roughly 70–80% of requested resources actually used, with enough headroom left to absorb a spike without evicting a neighbor.
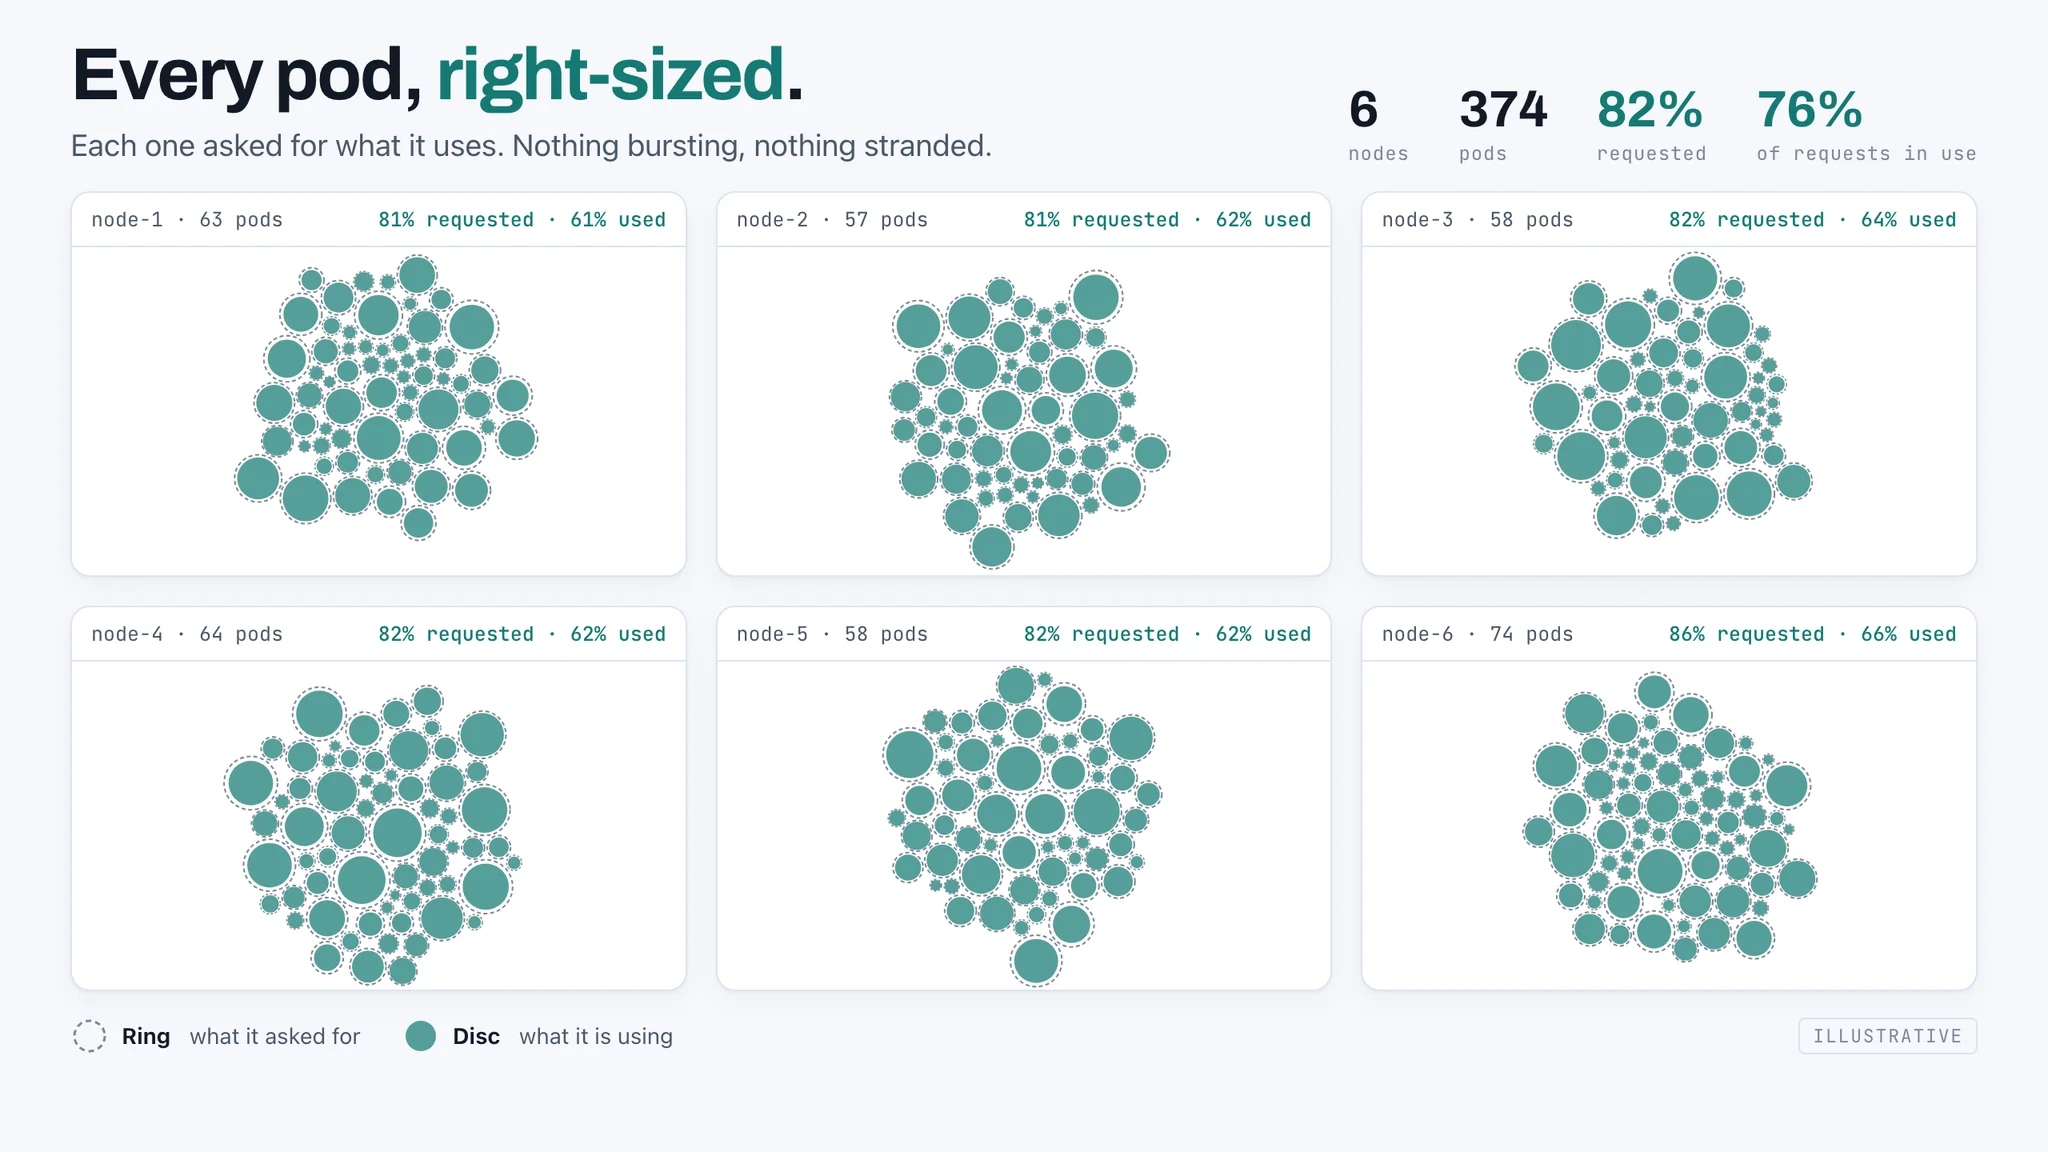
Getting there manually is a moving target. Requests are static until someone edits a manifest; usage is not. The gap between the two is where both waste and noisy-neighbor incidents live, and it reopens every time traffic patterns change.
A live poll during the session asked whether attendees had a strategy to automatically remediate noisy neighbors today. About 70% answered "no, but I've been dreaming about it."
Remediating at the pod layer: waste and resiliency
PerfectScale rightsizing works from historical utilization (p95, p100, max) and adjusts requests and limits in place. Vikram showed two live workloads that illustrate the two sides of the problem.
Waste. A data-provider workload had cost roughly $600 over 30 days, about a third of it unused capacity that was still being billed at the node layer. It started at ~26Gi requested and ~34Gi limit. After automation was enabled, requests stepped down gradually, each step small enough to stay clear of an OOM. Waste on the deployment fell from roughly 44–45% (about $14/day) to about $3/day, and the overall cost of the workload fell with it.
Resiliency. A steady workload hit a burst event with a visible ramp in memory. Because the node had capacity, PerfectScale raised limits first, then requests, and the pod never OOM-killed. That trade accepts a little more waste in exchange for stability, which is the correct default for an aggressor whose burst was not its fault.
Both behaviours are bounded by policy. If a workload is single-threaded, you can cap CPU at one core and allow small bursts; for memory you can allow requests to climb during high-traffic periods. The point is that the automation moves within limits you set, rather than replacing your judgement.
Remediating at the node layer: unevictable pods and Karpenter policy
Pod-level rightsizing only realises savings when nodes can actually consolidate. Two node-layer views came up.
Unevictable pods. PerfectScale surfaces which specific pods are preventing a node from being consolidated: a do-not-disrupt annotation, a PDB, local storage, and so on. In a multi-tenant node pool this matters because one pinned tenant can hold a node open while four idle tenants foot the bill. The remediation is to move that workload to a dedicated node pool where it can sit safely with similar pods. Today this is an insight you can act on manually or via the API; PerfectScale is releasing automated handling within the next month or two.
Karpenter consolidation policy. A ClickHouse node pool was running with consolidationPolicy: WhenEmpty, the Karpenter default. In a multi-tenant estate a node is almost never truly empty; there is usually something running at low utilization but not serving traffic. The recommendation was WhenEmptyOrUnderutilized, which lets Karpenter bin-pack further as long as the workload boundaries above are in place.
Who pays for what: attributing shared resources per tenant
Once the cluster is rightsized, the FinOps question arrives: who gets charged? A shared Bedrock inference endpoint the platform team deployed but only a few tenants call. A managed database several teams query. Cross-AZ traffic and NAT gateways that every pod on the cluster touches. None of this is taggable to a tenant with cloud-native tooling.
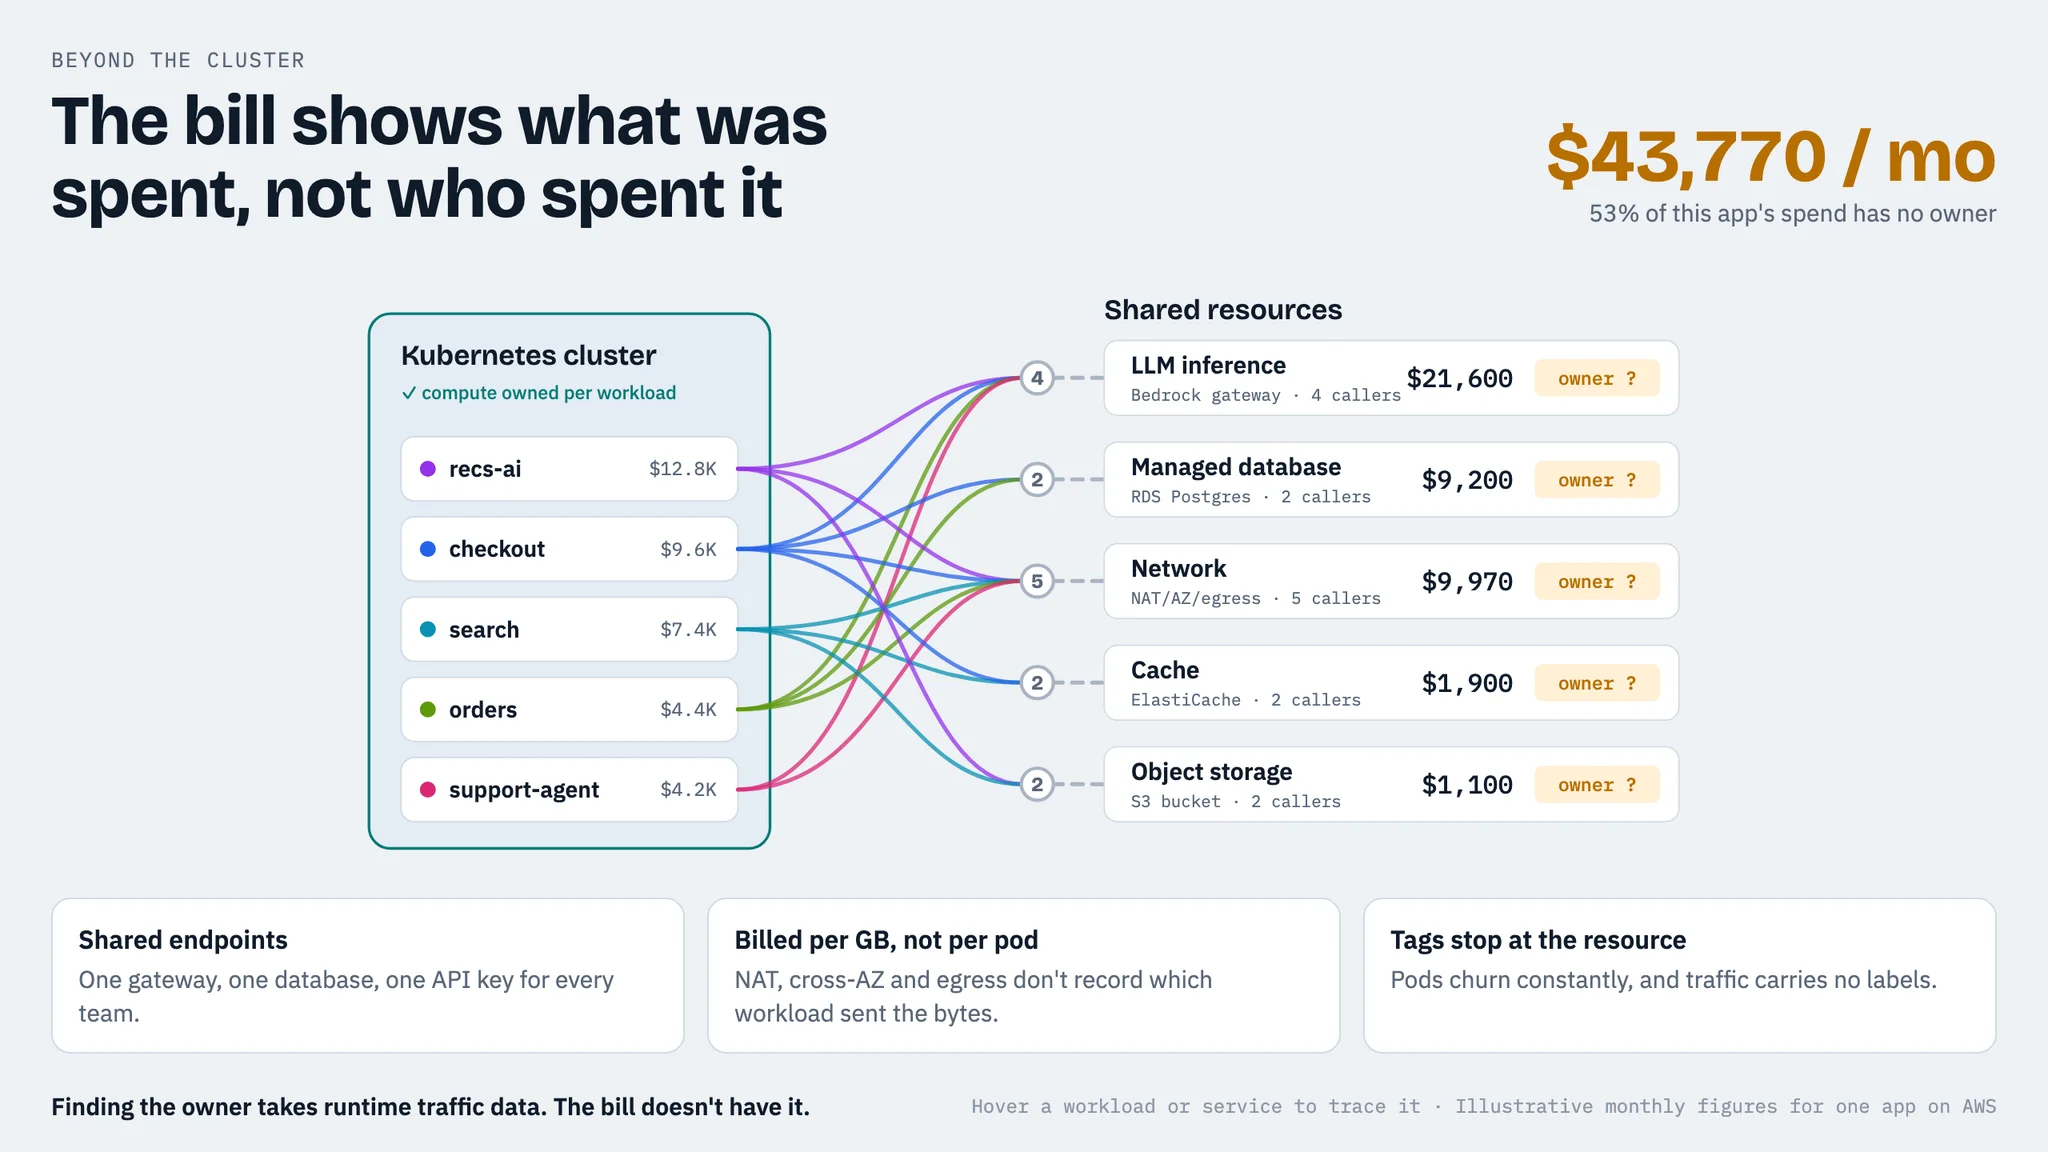
Hilli demonstrated Attribute, which groups Kubernetes workloads (Deployments, StatefulSets, whatever unit runs your business logic) into teams or products and shows each group's share of every shared cloud service it consumes.
Two examples from the demo:
- An LLM gateway workload consumed Bedrock, OpenAI, and a database. Attribute showed the workload's portion of each, down to the specific OpenAI model and its relative cost.
- A non-AI service showed its share of network (cross-AZ, NAT gateway, internet egress), self-managed Kafka, and other shared infrastructure. Network in particular cannot be tagged from inside the cluster, and Hilli noted it is where customers most often find savings, including replacing NAT gateway traffic with VPC endpoints.
The second lens is business-unit attribution. By following identifiers in traffic (customer ID, publisher, tenant header), Attribute breaks shared-service cost down to the customer level. That feeds margin analysis: is this customer profitable on this cluster, this database, this model?
How eBPF makes per-tenant cost attribution possible
Asked how the granularity is possible, Hilli explained the sensor. It is eBPF-based, the same kernel-level technique common in security tooling, repurposed for cost. It observes traffic leaving compute (cluster nodes or VMs) before encryption, records source workload and destination service, and calculates the path each packet took. Metrics are aggregated on the customer's premises, sensitive content is stripped, and only whitelisted metadata is collected.
Applied to a database, that means the sensor can see a query's WHERE customer = <id> clause metadata, assign a dollar value to it, and roll it up per customer. Applied to a cost anomaly, it means you can trace a spike back to a specific workload and the deployment that introduced it.
Try it yourself: repo, lab, and free tier
Everything shown in the first half runs locally.
- Plugin:
git clone https://github.com/perfectscale-io/noisy-neighbors && cd noisy-neighbors && make install && kubectl noisy-neighbors - Lab:
make lab-up && make demospins up a kind cluster with five deliberately broken tenants on one node (aggressor, OOM victim, throttled, over-requester, BestEffort). A hardened EKS variant with Karpenter is underdeploy/eks. - The wall:
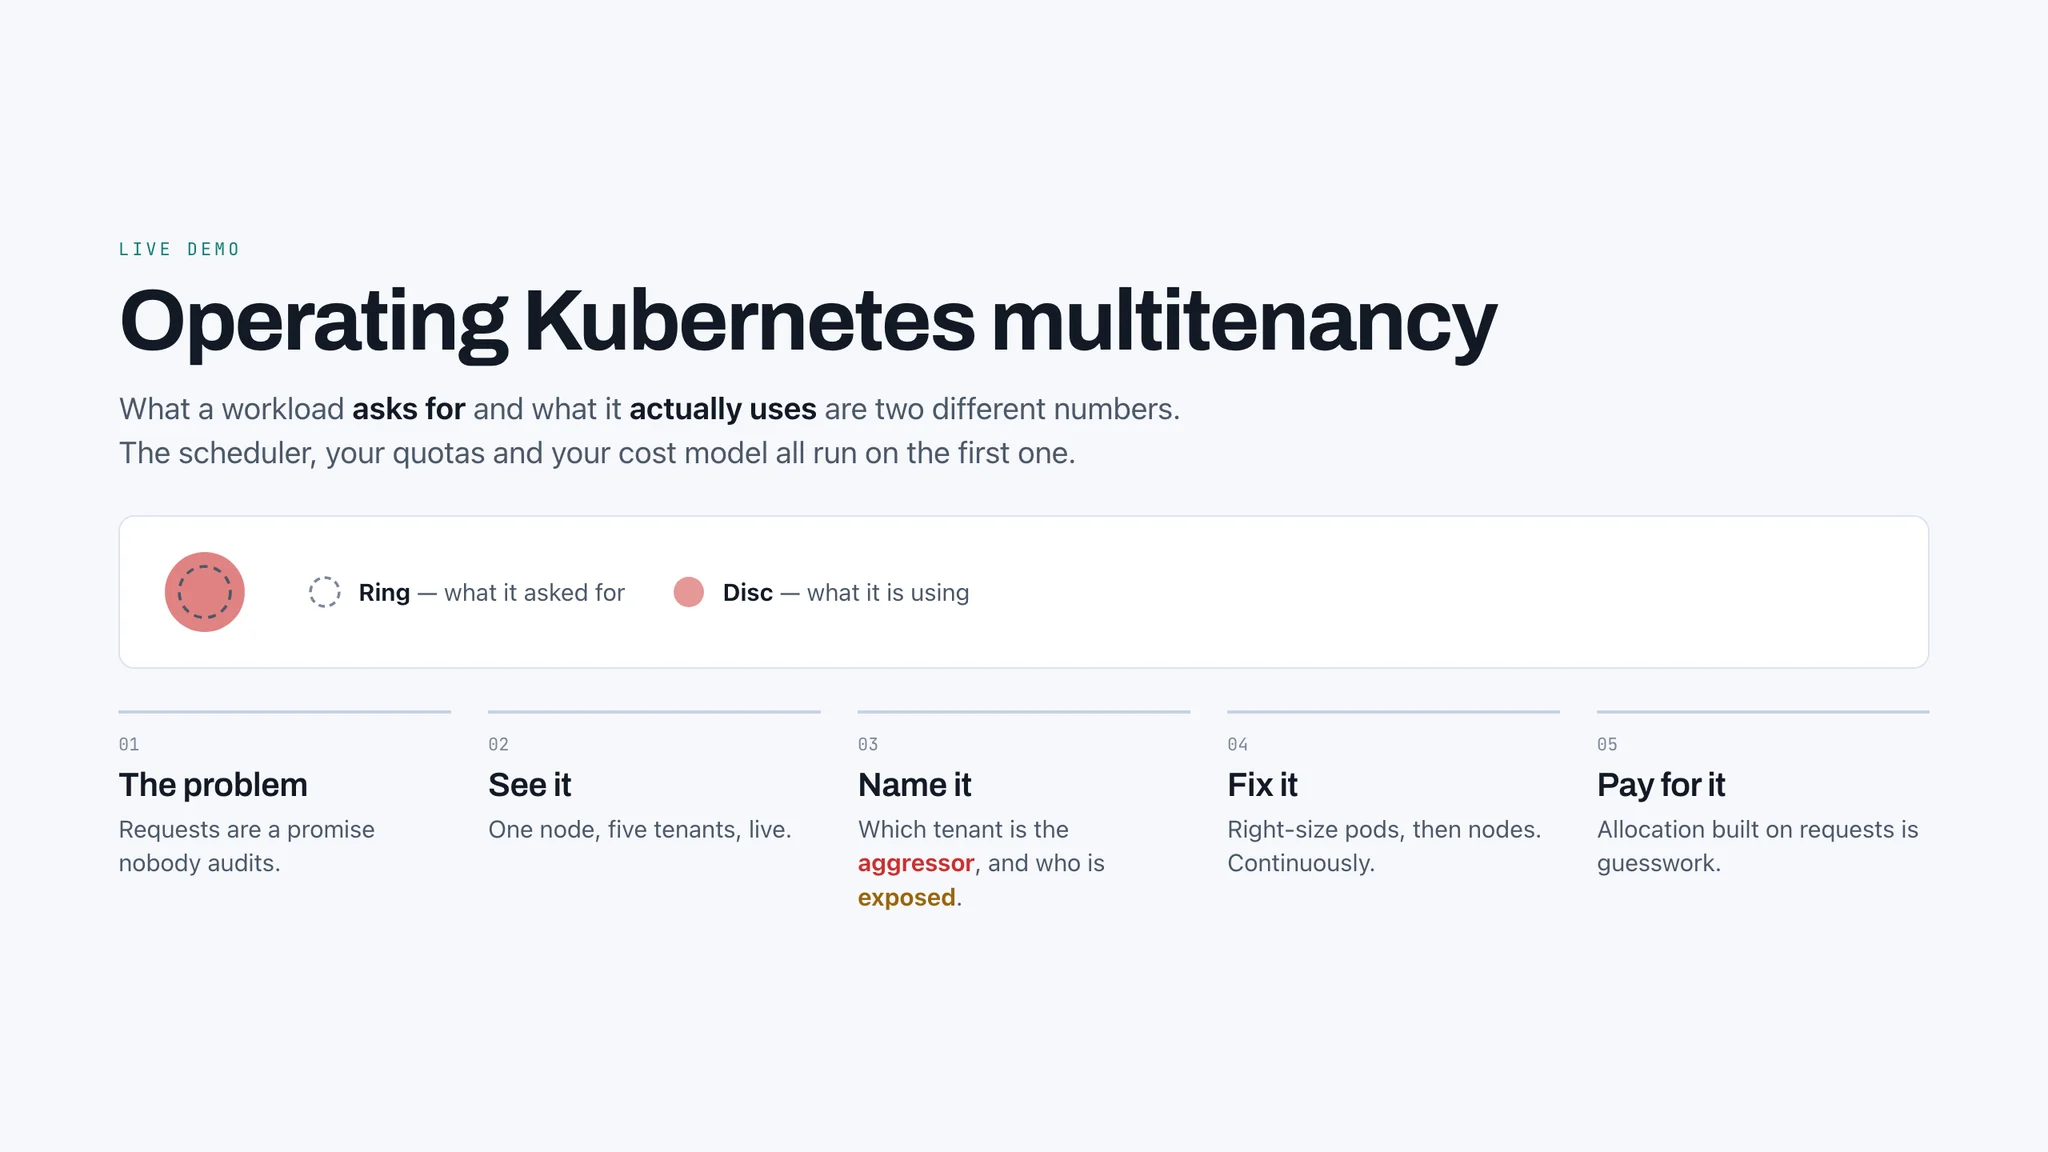
make wallserves the bubble visualization from the webinar (request as dashed ring, usage as solid disc) atlocalhost:8099. - Rightsizing:
deploy/eks/perfectscaleships PerfectScale automation as CRs with a timed before/after.
PerfectScale's community package optimizes up to 300 vCPUs per month free, so you can run the lab, connect it, and watch the remediation happen on your own cluster.
FAQ
What is a noisy neighbor in Kubernetes?
A noisy neighbor is a pod that consumes significantly more CPU or memory than it requested, degrading other pods scheduled on the same node. Because the scheduler places pods based on requests, not actual usage, an aggressor with a low request and high usage causes co-located tenants to be CPU-throttled or OOMKilled even though their own configuration is correct.
How do I find noisy neighbors in a Kubernetes cluster?
Run kubectl noisy-neighbors, an open-source read-only plugin from PerfectScale. It compares each pod's usage to its request, reads OOM and CFS throttling counters from the kubelet, and reports per node which tenants are aggressors and which are exposed. It needs only a read-only ClusterRole and metrics-server; no Prometheus, agent, or CRDs.
Does the noisy-neighbors plugin fix the problem?
No. It stops at diagnosis and does not modify anything in the cluster. Remediation requires rightsizing requests and limits, which PerfectScale automates at the pod and node layer within boundaries you define.
What utilization should a multi-tenant Kubernetes node target?
Roughly 70–80% of requested resources in actual use. Running at 100% leaves no room for bursts; running far below it means paid-for capacity is stranded behind requests nobody uses.
How does the plugin differ from KRR, Goldilocks, kube-capacity, or OpenCost?
KRR and Goldilocks give per-workload rightsizing recommendations. kube-capacity shows per-node requests versus limits versus utilization. OpenCost shows per-namespace cost. noisy-neighbors shows the per-node relationship between an aggressor and the tenants exposed to it, which none of the others report.
How do you allocate the cost of shared resources in a multi-tenant Kubernetes cluster?
Shared services such as managed databases, LLM inference endpoints, NAT gateways, and cross-AZ traffic cannot be tagged per tenant. Attribute by DoiT uses an eBPF sensor to observe which workload talks to which service, then assigns each tenant, team, or customer its proportional share of the cost.
Is eBPF-based cost attribution safe for sensitive data?
The sensor collects metadata about traffic (source, destination, volume, query shape), not payloads. Metrics are aggregated on the customer's own infrastructure, sensitive fields are stripped, and only whitelisted metrics are collected.
Which Karpenter consolidation policy should a multi-tenant node pool use?
WhenEmptyOrUnderutilized. The default WhenEmpty rarely triggers in a shared cluster because nodes almost always have some low-utilization workload on them. The underutilized policy lets Karpenter consolidate as long as workload disruption boundaries (PDBs, do-not-disrupt annotations) are set correctly.