
PerfectScale
Kubernetes Node Not Ready: Troubleshoot Common Causes & Best Practices
A Kubernetes node enters a NotReady state when the control plane cannot communicate with it or when a critical system component on the node fails.
This page is also available in Deutsch, Español, Français, Italiano, 日本語, and Português.


What is Kubernetes Node Not Ready Error?
A Kubernetes node enters a NotReady state when the control plane cannot communicate with it or when a critical system component on the node fails. When a node is in the NotReady state, the Kubernetes control plane stops scheduling the new pods onto that node and reschedules the existing pods to other healthy nodes to keep the desired state of the cluster. The node controller continuously monitors the health of nodes; if a node fails to report back within a specific grace period, it is marked as NotReady.
Nodes that show NotReady status are in the NotReady state:
NAME STATUS AGE VERSIONnode-1 Ready 18d v1.29.1node-2 NotReady 18d v1.29.1Understanding the Kubernetes Node States:
Kubernetes nodes can be in various states, indicating their status and health. It can be one of the following:
1. Ready: The node is healthy and ready to run pods. It means that the node is functioning properly and can host workloads.
2. NotReady: The node is not healthy and cannot run pods. It means the node is experiencing issues. Pods scheduled on this node may be evicted or rescheduled to other nodes.
3. SchedulingDisabled: When the node is in the SchedulingDisabled state, the node is marked as unschedulable, meaning no new pods will be scheduled on it.
4. Unknown: If the node controller is unable to communicate with the node in the last node-monitor-grace-period (default 50s) time, the node status is shown as unknown.

Causes of Kubernetes Node NotReady Error:
Various issues can cause a Kubernetes node to show a NotReady status. Let's discuss:
1. Lack of Resources: Nodes in a Kubernetes cluster require sufficient CPU, memory, and disk resources to function properly. When these resources are exhausted, the node may become unresponsive or unable to manage its workloads effectively, leading to a NotReady status. High CPU or memory usage can cause pods to be evicted or fail to start. Disk pressure occurs when disk usage exceeds a certain threshold, leading to the node being marked as NotReady.
2. Issues with the Kubelet: The Kubelet is the agent running on each node, responsible for managing pods and containers. If the Kubelet crashes or is misconfigured, it can't communicate with the API Server, and the node may become NotReady. The node status shows conditions like KubeletNotReady.
3. Issues with Kube-Proxy: Kube-Proxy is responsible for maintaining network rules on nodes. If kube-proxy crashes or is misconfigured, it can disrupt network traffic, leading to the node being marked as NotReady.
4. Connectivity Issues: Network connectivity is important for nodes to communicate with the control plane and other nodes in the cluster. Network misconfigurations can disrupt this communication, causing nodes to fail to report their status and leading to a NotReady state.
Note: During the initial phase of a node joining the cluster, it may temporarily display a NotReady status. This is a normal part of the process and should not be a cause for concern unless the node remains in this state for an extended period.
Troubleshooting Kubernetes Node NotReady Errors:
1. Check the Node Status: To ensure the error you are facing is due to an unhealthy node, the status is shown as NotReady in the Kubectl get nodes command. This command provides the current status of the nodes. If a node is marked as NotReady, it indicates that the node is not functioning correctly and cannot schedule new pods.
kubectl get nodesNAME STATUS AGE VERSIONnode-1 Ready 18d v1.29.1node-2 NotReady 12d v1.29.12. Check the Node's Details and Conditions: To gain more information about the node, you can use the kubectl describe node command. This command provides detailed information about the node, including its conditions and events. By examining the conditions section, you can identify specific issues such as memory pressure, disk pressure, or network problems that might be causing the node to be NotReady.
kubectl describe node node-2
Conditions:Type            Status     Reason                        Message----            ------     ------                        —-----MemoryPressure   True      KubeletHasInsufficientMemory  kubelet has insufficient memory availableDiskPressure     False     KubeletHasNoDiskPressure      kubelet has no disk pressurePIDPressure      False     KubeletHasSufficientPID       kubelet has sufficient PID availableReady            False     KubeletNotReady               Node is under memory pressure
MemoryPressure - specify whether a node is running low on available memory.
DiskPressure - signifies whether a node is running out of disk space.
PIDPressure - refers to whether a node is running too many processes.
If any of these conditions are True, it typically means the node is under resource pressure and may not be able to handle workloads effectively. As a result, the node is marked as NotReady, indicating it cannot run the pods. To know more about the node conditions, refer this.
3. Kubelet Issue: If all conditions are unknown, it means the kubelet on the node is down, causing the node to go into a NotReady state.
Conditions:Type Status Reason---- -—--- ------MemoryPressure Unknown NodeStatusUnknownDiskPressure Unknown NodeStatusUnknownPIDPressure Unknown NodeStatusUnknownReady Unknown NodeStatusUnknownThe kubelet is the sole point of contact for the Kubernetes cluster, managing the lifecycle of containers on the node, and if it is not running, the node will not be able to report its status correctly. To diagnose this, you can check the Kubelet logs on the node for any errors or issues.
4. Check Kubernetes System Pods: To diagnose, check the status of the Kubernetes system pods using the kubectl get pods -n kube-system command. These pods are critical for the operation of the cluster, and if any of them are not running correctly, it can affect the status of the nodes.
kubectl get pods -n kube-systemNAME READY STATUS RESTARTScoredns-558bd4d5db-7x8k4 1/1 Running 0coredns-558bd4d5db-8x9k5 1/1 Running 0etcd-master 1/1 Running 0kube-apiserver-master 1/1 Running 0kube-controller-manager-master 1/1 Running 0kube-proxy-4x8k4 0/1 CrashLoopBackOff 5kube-scheduler-master 1/1 Running 0To see only the pods assigned to a specific node, you can use:
kubectl get pods -n namespace-name --field-selector spec.nodeName=node-name5. Checks for connectivity: To diagnose connectivity problems, you can use the
kubectl get node ${NODE_NAME} -o jsonpath='{.status.conditions[*]}' | jq -c '.[] | .type + " is " + .status'command and look for the NetworkUnavailable flag in the conditions section. If this flag is True, it means the node has a connectivity issue.
Conditions:Type Status---- —----NetworkUnavailable TrueFixing Node NotReady Issues:
1. Resolve Lack of Resources: You can increase the resources available to the node or reduce resource consumption by scaling down the workloads or optimizing the resource requests and limits for your pods. You can use commands like top or htop on the node to monitor resource usage. Identifying and shutting down non-Kubernetes processes, running malware scans, upgrading the node, and checking for hardware issues or misconfigurations can also help conserve resources and resolve the issue.
2. Resolve Kubelet Issues: To resolve kubelet issues, SSH into the node and run systemctl status kubelet. The status can be: active (running), active (exited), or inactive (dead).
active (running): The kubelet is operational, and the issue might be elsewhere.
active (exited): The kubelet exited, maybe due to an error. Restart it using sudo systemctl restart kubelet.
inactive (dead): The kubelet crashed. Use journalctl -u kubelet to examine the logs and identify the cause.
If the kubelet service is running and has the necessary permissions but the node is NotReady, it also makes sense to look in the kubelet logs—it may be erroring but not crashing.
3. Resolve Kube-Proxy Issues: Check the logs of the kube-proxy pod to identify any errors or warnings. Make sure the kube-proxy as DaemonSet is configured correctly. If you identify any issues with the kube-proxy pod, you can delete it to force a restart. The DaemonSet controller will automatically create a new pod.
4. Checking Connectivity: Check the network configuration on the node, ensure that the necessary ports are open, and verify that the network plugins are correctly installed and configured. You can use commands like ping or traceroute to test network connectivity from the node to other nodes or external endpoints.
ping node-iptraceroute node-ipCauses of Kubernetes Node NotReady Error:
Kubelet Is Stopped or Unhealthy
The kubelet is the primary agent running on every Kubernetes node. It communicates with the control plane, reports node status, and ensures that containers defined in pod specifications are running. If the kubelet process stops, crashes, or becomes unresponsive, the control plane cannot receive health updates from the node.
Common causes include service failures, configuration errors, expired certificates, resource exhaustion, or failed upgrades. Once the kubelet stops sending heartbeats, the node is eventually marked as NotReady after the node monitor grace period expires.
PLEG (Pod Lifecycle Event Generator) Errors
The kubelet uses the Pod Lifecycle Event Generator (PLEG) to track pod and container state by polling the container runtime at regular intervals. If PLEG cannot complete a relist within the configured threshold, the kubelet reports the node as NotReady with an error such as PLEG is not healthy: pleg was last seen active X ago.
PLEG failures are commonly caused by a container runtime under heavy load, too many containers running on a single node, disk I/O pressure, or stuck containers that the runtime cannot respond about. These are among the most common causes of NotReady nodes in production, especially on nodes with high pod density.
Control Plane Connectivity Problems
A node can also enter the NotReady state if it loses network connectivity to the Kubernetes API server. Although workloads may continue running locally, the kubelet cannot report node status or receive updates from the control plane.
Connectivity problems are commonly caused by firewall changes, DNS failures, routing issues, VPN disruptions, load balancer failures, or API server outages. Restoring communication between the node and the control plane typically returns the node to the Ready state.
Container Runtime Failure
The kubelet depends on a container runtime such as containerd or CRI-O to create and manage containers. If the runtime stops, crashes, or becomes unhealthy, the kubelet cannot start or monitor pods correctly.
Container runtime failures can result from configuration errors, disk corruption, software bugs, or resource shortages. In this situation, the kubelet reports runtime errors, and the node may transition to NotReady until the runtime is functioning again.
CNI and Node Networking Problems
Kubernetes relies on a container network interface (CNI) plugin to provide networking for pods. If the CNI plugin is missing, misconfigured, or unable to initialize, pods cannot receive network connectivity, and node health checks may fail.
Network issues can also be caused by incorrect routes, firewall rules, network policy changes, or failures in the underlying network infrastructure. These problems can prevent the kubelet from communicating with required services and cause the node to be marked as NotReady.
Memory Exhaustion
When a node runs out of available memory, the operating system may begin killing processes, including Kubernetes components. Severe memory pressure can prevent the kubelet and container runtime from operating reliably.
Memory exhaustion is often caused by applications consuming excessive memory, memory leaks, or insufficient node capacity. Kubernetes reports memory pressure as a node condition, and if critical services become unstable, the node can enter the NotReady state.
Cloud Provider or Virtual Machine Issues
In cloud environments, node availability also depends on the health of the underlying virtual machine or instance. Infrastructure problems can interrupt networking, storage, or compute resources even when Kubernetes itself is configured correctly.
Examples include instance reboots, hardware failures, failed autoscaling operations, storage attachment problems, or cloud maintenance events. If these issues prevent the kubelet from operating or communicating with the control plane, the node is marked as NotReady until the infrastructure recovers.
How to Prevent Kubernetes Nodes from Becoming Not Ready
1. Set Accurate Resource Requests and Limits
Define CPU and memory requests for every workload so the scheduler can place pods on nodes with sufficient capacity. Configure limits to prevent individual containers from consuming excessive resources and affecting other workloads on the same node.
Regularly review resource usage and adjust requests and limits based on actual application behavior. Accurate resource allocation reduces the risk of memory pressure, CPU starvation, and node instability that can lead to the NotReady state.
Avoid relying on default or estimated values for production workloads. Instead, use historical metrics from monitoring tools to size requests appropriately. This improves scheduling decisions, reduces resource contention, and helps maintain stable node performance as workloads grow.
2. Reserve Resources for System Processes
Configure systemReserved and kubeReserved in the kubelet configuration to reserve CPU, memory, and storage for the operating system and Kubernetes components. This ensures that critical services such as the kubelet, container runtime, and networking processes continue to function even during periods of high workload.
Without reserved resources, application pods can consume nearly all available capacity, leaving insufficient resources for essential node services. This increases the likelihood of the node becoming unresponsive.
Resource reservation is especially important on smaller nodes or clusters with high resource utilization. By protecting the resources required by system processes, the node remains responsive and can continue reporting its health to the control plane during periods of heavy load.
3. Configure Node-Pressure Eviction Thresholds
Configure kubelet eviction thresholds to proactively remove pods before the node reaches critical resource pressure. Kubernetes supports eviction based on available memory, disk space, and inode usage, helping maintain node stability.
Appropriate eviction settings prevent resource exhaustion from affecting core Kubernetes services. Review the default thresholds and adjust them to match your workloads and infrastructure requirements.
Configure both hard and soft eviction thresholds based on the expected behavior of your applications. Properly tuned eviction policies allow Kubernetes to recover from temporary resource spikes without allowing nodes to reach a state where the kubelet or container runtime becomes unstable.
4. Monitor Node Health Continuously
Use monitoring tools such as Prometheus, Grafana, or cloud-native monitoring services to track node health metrics, including CPU, memory, disk usage, network connectivity, and kubelet status. Configure alerts for abnormal conditions so issues can be investigated before they affect workload availability.
In addition to infrastructure metrics, monitor node conditions such as Ready, MemoryPressure, DiskPressure, and PIDPressure. Early detection allows administrators to resolve problems before nodes transition to the NotReady state.
Log aggregation and event monitoring are equally important. Collect kubelet logs, container runtime logs, and Kubernetes events in a centralized platform to simplify troubleshooting and identify recurring issues before they impact multiple nodes.
5. Automate Node Repair and Replacement
Implement automated recovery mechanisms to repair or replace unhealthy nodes with minimal manual intervention. Managed Kubernetes services often include node auto-repair features that restart, recreate, or replace failed instances when health checks fail.
In self-managed clusters, combine health monitoring with automation tools to cordon, drain, and replace unhealthy nodes. Automated remediation reduces recovery time and helps maintain cluster availability during infrastructure failures.
Automation should also include validation after recovery. Once a replacement node joins the cluster, verify that it reaches the Ready state, the required system components are running correctly, and workloads are rescheduled successfully. This reduces the risk of recurring failures and minimizes operational effort.
We have discussed in detail the various causes of the Kubernetes Node NotReady state and their solutions. Whether it is a lack of resources, problems with Kubelet or Kube-Proxy, or network connectivity issues, by following the above steps, you can identify this issue, resolve it effectively, and ensure a more stable and efficient Kubernetes environment.
Fix Kubernetes Node NotReady Errors 10x Faster with PerfectScale by DoiT
PerfectScale Kubernetes governance platform continuously monitors workload behavior and detects signs of instability, such as OOM events or CPU throttling, that often lead to crash loops.
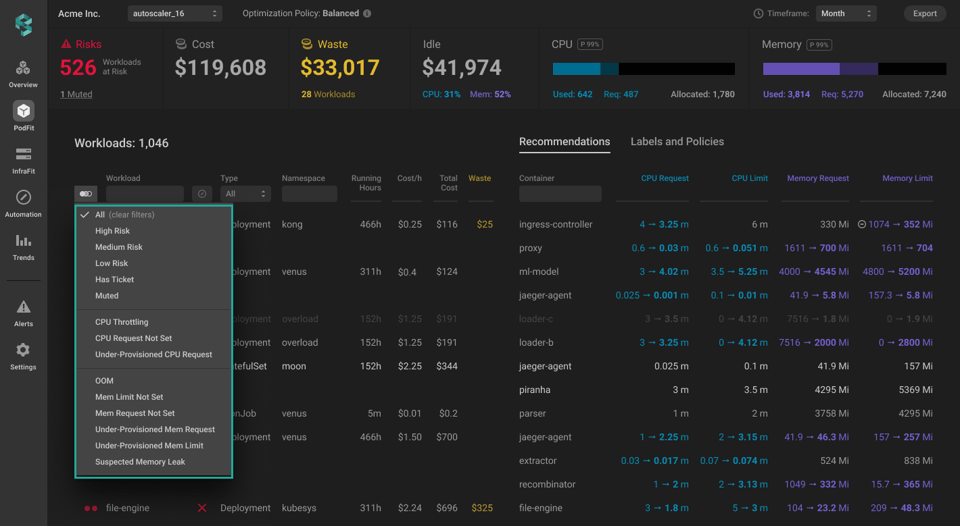
Identify up to 30 Different Resilience Types of Risks
PerfectScale’s tracks up to 30 K8S alerts are tailored specifically for Kubernetes. They cover a wide range of potential issues, such as pod failures or resource exhaustion, eliminating the need for deep Kubernetes expertise.
Real-time Alerts without Alert Fatique
PerfectScale allows users to easily set up alerts for their clusters and manage them efficiently with Alert Profiles. You can easily monitor and get notified about alerts that are relevant for your setup.
For faster updates, utilize Slack or MS Teams Integration Profiles to receive notifications when an Alert is generated.
Get Actionable Recommendations to Eliminate Kubernetes Node NotReady Error
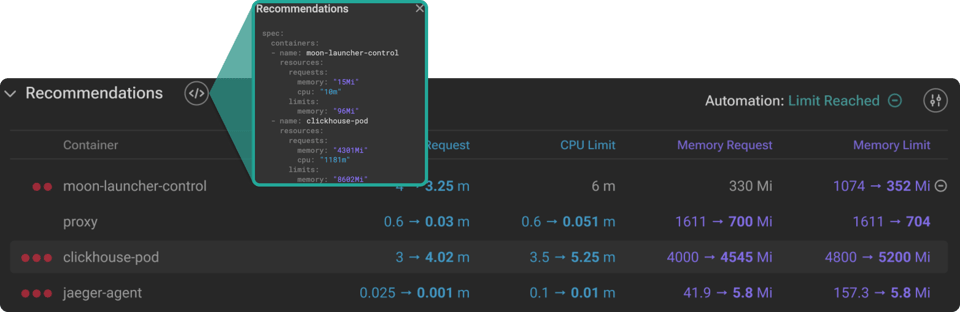
By leveraging real usage data and resilience-aware policies, PerfectScale delivers precise recommendations for right-sizing workloads at the container level, ensuring workloads have exactly what they need. Whether applied manually or autonomously for immediate impact, these recommendations restore workload stability, eliminate recurring restarts, and help prevent similar failures in the future.
To apply the recommendations, you can effortlessly copy the .yaml and deploy it to your cluster.
Join industry leaders like Paramount Pictures and Creditas who have already optimized their Kubernetes environments with PerfectScale. Sign up or Book a demo with our technical experts now!