Essential Kubernetes Autoscaling Guide: Karpenter Monitoring with Prometheus


Kubernetes autoscaling plays a pivotal role in achieving efficient resource management and ensuring optimal performance. Karpenter, an open-source project by AWS, simplifies Kubernetes cluster scaling by automating the provisioning and decommissioning of nodes based on resource demands. However, to unleash the full potential of Kubernetes autoscaling, monitoring its performance is essential. This article explores the significance of monitoring Karpenter with Prometheus and the potential consequences of neglecting this crucial aspect with real hands on examples and Grafana dashboards.

Understanding Karpenter and Its Role in Kubernetes Autoscaling
Karpenter acts as an intelligent layer that sits on top of Kubernetes, handling node provisioning and decommissioning seamlessly. It analyzes the resource utilization of a cluster and scales the infrastructure up or down accordingly. This dynamic Kubernetes autoscaling capability ensures cost-effectiveness and efficient resource utilization.
The Role of scaling Prometheus in Monitoring Karpenter:
Prometheus, a leading open-source monitoring and alerting toolkit, provides a robust solution for monitoring Kubernetes clusters. When integrated with Karpenter, Prometheus collects crucial metrics, such as node utilization, pod metrics, and scaling events, enabling administrators to gain insights into the performance of the Kubernetes autoscaling processes.

Our way with Karpenter
In Perfectscale, our acquaintance with Karpenter began more than a year ago. It was tested on the dev environment and then successfully installed in production, and we were delighted with its flexibility and ease of operation.
But a few months ago, we received an alert indicating that some of our pods were in a pending state. Initially, the engineer on duty didn't pay much attention, as occasional instances of no available spot instances in the Amazon region can occur. Since it was only one replica out of ten and didn't significantly impact system operation, it wasn't a cause for concern. However, as the number of pending pods increased over time, it became evident that there was an underlying issue, signaling a more subtle problem.
We started checking everything one by one. In Karpenter’s logs it is clear that it finds pods in pending status, scales a new instance for them, there are no errors. In the Amazon console it is also clear that new instances are appearing, but we did not see these instances in the Kubernetes cluster, and the nodes were not registered in the cluster. After some time investigating on newly launched instances we found that the bootstrap.sh script could not start the kubelet due to an error “invalid option name: “--max-pods“.

This was strange because:
- We didn’t explicitly specify this flag anywhere
- It is a valid flag for kubelet startup.
Finally, we found that the AMI for EKS ubuntu-eks/k8s_1.27/images/hvm-ssd/ubuntu-focal-20.04-amd64-server-20231130 was released with a bug and it did not work correctly.
To quickly solve the problem, we decided to replace the image with a previously working one for all EC2NodeClasses by adding next configuration to the EC2NodeClass:
Scaling Prometheus
Since initially at Perfectscale we built a fault-tolerant and highly available system and responded relatively quickly to the incident, this incident did not affect anything and we had no customer impact. But we still lost some time thinking that the problem was not serious, and if we had initially known that Karpenter was scaling the nodes but they were not registered in the cluster, the response and resolution of the incident would have been much faster. That’s when we realized we need to invest in Karpenter-specific monitoring.
As you might have guessed, next we will talk about setting up monitoring
We will need a working installation of the Prometheus Operator, if you don’t have Prometheus, you can read here how to install it and Karpenter provides many useful metrics for every component such as:
- Consistency metrics.
- Disruption Metrics.
- Interruption Metrics.
- Nodeclaims Metrics.
- Provisioner Metrics.
- Nodepool Metrics.
- Nodes Metrics.
- Pods Metrics.
- Cloudprovider Metrics.
- Cloudprovider Batcher Metrics.
You can find the full list of metrics with explanations in the documentation. All you need to do to start scraping Karpenter metrics is enable the serviceMonitor in the Karpenter helm chart by setting: “serviceMonitor.enabled=true“
or add it to the override value file
Note, if you are using some labels in the Prometheus to recognize CRDs, do not forget to add them to the additionalLabels
If you configured everything correctly - in a few minutes you should see a new target appear in Prometheus

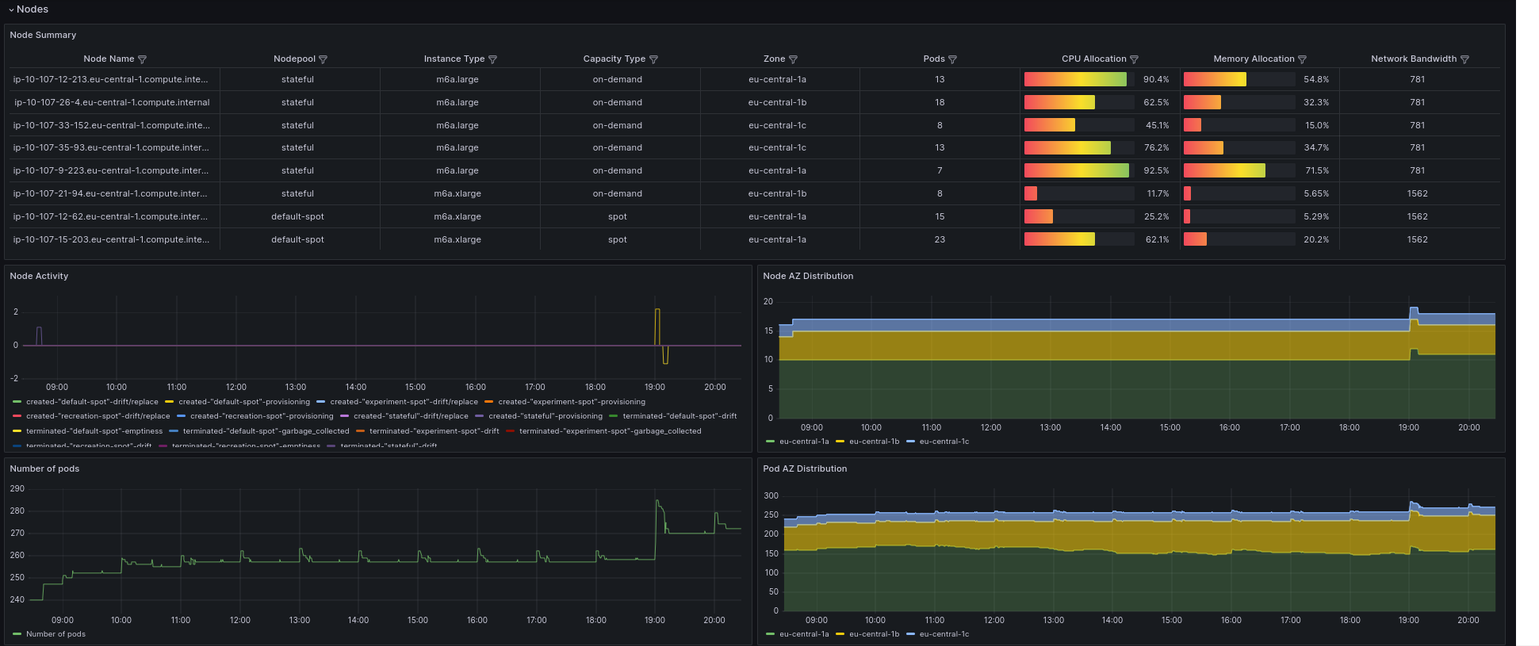
Once we have the metrics we can visualize them in Grafana.
We have already prepared a dashboard that you can download from grafana.com or import with ID 20398, but be aware it works with >=0.33 version of Karpenter, in the previous version some metrics had different names.
Visualization is of course good for analysis, but we need to immediately find out that something is wrong with the infrastructure, so let’s create several alerts. PrometheusRules will help us with that.
In this article I will show you 3 alerts to scale Promethes but you can create as much as you need.
The first one will show us the situation we were in, when new nodes could not register in the cluster, for that we will use 2 metrics:
- karpenter_nodeclaims_launched (Number of nodeclaims launched in total by Karpenter. Labeled by the owning nodepool.)
- karpenter_nodeclaims_registered (Number of nodeclaims registered in total by Karpenter. Labeled by the owning nodepool.)
Usually they should be the same and if this is not the case then something has happened
The second one will show us that we are approaching the CPU or Memory limit set on the Nodepool
- karpenter_nodepool_usage(The nodepool usage is the amount of resources that have been provisioned by a particular nodepool. Labeled by nodepool name and resource type.)
- karpenter_nodepool_limit(The nodepool limits are the limits specified on the nodepool that restrict the quantity of resources provisioned. Labeled by nodepool name and resource type.
karpenter_nodepool_usage)
In the third, we want to find out the situation in which the Karpenter cannot communicate with the Cloud provider
- karpenter_cloudprovider_errors_total(Total number of errors returned from CloudProvider calls.)
Finally PrometheusRule file will be next:
Of course, it’s not worth stopping at only 3 alerts, you can create different alerts your suit your needs.
Conclusion
In embracing the power of Karpenter and Prometheus, we've not only streamlined our Kubernetes autoscaling processes but also fortified our infrastructure with a robust monitoring framework. The scaling Prometheus into our ecosystem has empowered us with a comprehensive dashboard that paints a vivid picture of our cluster's health, providing real-time insights into node utilization, pod metrics, and scaling events.
The dashboard acts as our watchtower, offering a bird's-eye view of the entire Kubernetes landscape. With a quick glance, we can assess resource utilization, identify potential bottlenecks, and track the performance of our Kubernetes autoscaling mechanisms. This newfound visibility has not only optimized our resource allocation but also enabled us to proactively address any anomalies before they escalate into critical issues.
However, the power of Prometheus extends beyond mere observation. The alerting capabilities embedded within Prometheus serve as our vigilant guardians, tirelessly monitoring the system for any deviations from the norm. As a result, we are no longer in the dark about potential scaling delays, performance degradation, or security threats. Instead, we receive timely notifications, allowing us to spring into action and maintain the integrity and security of our Kubernetes environment.

.png)

.png)