Best Kubernetes Monitoring Tools in 2024

Kubernetes monitoring is an essential aspect of managing and optimizing your Kubernetes environment. By monitoring your K8s clusters, you gain valuable insights into the health, performance, and utilization of your applications.
In this article, we will discuss what is Kubernetes monitoring, its benefits, and the top Kubernetes monitoring tools for your needs.

What Is Kubernetes Monitoring?
Kubernetes Monitoring or K8s Monitoring refers to the process of collecting data and metrics from Kubernetes clusters to ensure the efficient operation of your containerized applications. It involves monitoring the performance and health of pods, nodes, containers, and other Kubernetes resources. By monitoring your clusters, you can detect and resolve any issues or bottlenecks that might impact your applications' availability and performance.
Monitoring is a critical aspect of managing Kubernetes clusters. It provides insights into the overall health and performance of your applications, allowing you to proactively address any potential issues before they impact your users. With K8s monitoring, you can gain a deep understanding of how your clusters are performing, identify any resource constraints, and optimize your infrastructure to ensure optimal performance.
One of the key components of K8s monitoring is collecting and analyzing metrics. Kubernetes provides a rich set of metrics that can be collected and monitored to gain insights into the behavior of your clusters. These metrics include CPU and memory utilization, network traffic, disk usage, and many others. By analyzing these metrics, you can identify any abnormal patterns or trends and take appropriate actions to optimize your clusters.
In addition to metrics, Kubernetes monitoring also involves monitoring the health of individual components within your clusters. This includes monitoring the availability and performance of pods, nodes, and containers. By monitoring the health of these components, you can quickly identify any issues or failures and take corrective actions to ensure the uninterrupted operation of your applications.
Furthermore, Kubernetes monitoring allows you to set up alerts and notifications based on predefined thresholds. This enables you to receive real-time notifications when certain metrics or conditions exceed the defined thresholds. By setting up alerts, you can proactively address any potential issues and minimize the impact on your applications.
Another important aspect of Kubernetes monitoring is visualizing the collected data. Kubernetes provides various tools and frameworks that allow you to visualize the metrics and health status of your clusters. These visualizations can help you gain a better understanding of the overall performance of your applications and identify any areas that require optimization or improvement.
Moreover, K8s monitoring is not limited to just monitoring the clusters themselves. It also involves monitoring the applications running within the clusters. This includes monitoring the performance and availability of individual microservices or applications deployed on Kubernetes. By monitoring the applications, you can ensure that they are running smoothly and efficiently, and quickly identify any issues that might impact their performance.
In conclusion, Kubernetes monitoring is a crucial part of managing and optimizing your containerized applications. By collecting and analyzing metrics, monitoring the health of your clusters and applications, setting up alerts, and visualizing the data, you can ensure the efficient operation of your Kubernetes infrastructure and deliver a seamless experience to your users.
Pros and Cons of Kubernetes Service Monitoring
Like any other technology, K8s monitoring has its advantages and disadvantages. Let's explore some of them:
K8s Monitoring Advantages:
- Identify performance bottlenecks: Through kubernetes service monitoring, you can easily identify resource-hungry components and optimize their usage.
One of the key advantages of K8s monitoring is the ability to identify performance bottlenecks. With the help of monitoring tools, you can easily pinpoint resource-hungry components within your Kubernetes clusters. This allows you to optimize their usage, ensuring that your applications run smoothly and efficiently. By addressing these bottlenecks, you can significantly improve the overall performance of your Kubernetes infrastructure.
- Alerts and notifications: K8s monitoring tools enable you to set up alerts and receive notifications in case of any abnormal behavior or critical issues.
Another advantage of Kubernetes service monitoring is the ability to set up alerts and receive notifications. K8s monitoring tools provide you with the capability to define specific thresholds and conditions for triggering alerts. This means that you can be immediately notified in case of any abnormal behavior or critical issues within your Kubernetes environment. By being proactive and addressing these issues promptly, you can prevent potential downtime and ensure the availability of your applications.
- Capacity planning: By monitoring your Kubernetes clusters, you gain insights into resource utilization trends, enabling better capacity planning.
Capacity planning is also greatly facilitated by K8s monitoring. By monitoring resource utilization trends, you can gain valuable insights into how your Kubernetes clusters are utilizing their resources. This information allows you to make informed decisions regarding capacity planning, ensuring that you have the right amount of resources allocated to meet the demands of your applications. With proper capacity planning, you can avoid resource shortages or overprovisioning, leading to cost savings and optimal performance.
K8s Monitoring Disadvantages:
- Resource consumption: K8s monitoring can consume additional resources, impacting the performance of your Kubernetes clusters.
While Kubernetes service monitoring offers numerous benefits, it is important to consider the potential drawbacks as well. One of the main disadvantages is the additional resource consumption that monitoring can introduce. Kbernetes monitoring tools require resources to collect and process data, which can impact the performance of your Kubernetes clusters. It is essential to carefully manage and allocate resources to ensure that monitoring does not negatively affect the overall performance of your infrastructure.
- Complexity: Implementing monitoring requires careful planning and configuration, which adds complexity to your infrastructure.
Another challenge associated with Kubernetes monitoring is the complexity it introduces to your infrastructure. Implementing K8s service monitoring requires careful planning and configuration to ensure that it captures the necessary data and provides meaningful insights. This complexity can add an additional layer of management and maintenance overhead, requiring skilled personnel and potentially increasing the overall complexity of your infrastructure. It is crucial to have a well-defined monitoring strategy and the necessary expertise to effectively implement and manage monitoring in your Kubernetes environment.
Understanding Kubernetes Monitoring Metrics
When it comes to monitoring K8s clusters, there are several additional metrics and indicators that can provide valuable insights into the performance and health of your infrastructure.
One important metric to consider is the container restart count. This metric measures the number of times a container has been restarted due to failures or other issues. By monitoring this metric, you can identify containers that are experiencing frequent restarts and take appropriate actions to resolve the underlying problems.
Another useful metric is the pod eviction count. This metric tracks the number of times a pod has been evicted from a node due to resource constraints or other reasons. Monitoring this metric can help you identify nodes that are frequently evicting pods and take steps to address the resource allocation issues.
Furthermore, monitoring the pod status can provide insights into the overall health of your applications. By tracking metrics such as the number of running pods, pending pods, and failed pods, you can quickly identify any issues and take proactive measures to ensure the availability and reliability of your applications.
In addition to these metrics, it is also important to monitor the cluster-wide resource utilization. This includes metrics such as the overall CPU and memory usage across all nodes in the cluster. By keeping an eye on these metrics, you can identify any potential resource bottlenecks and take corrective actions to optimize resource allocation.
Moreover, monitoring the cluster autoscaler metrics can help you ensure that your cluster is scaling up or down based on the workload demands. By tracking metrics such as the number of nodes added or removed by the autoscaler, you can ensure that your cluster is dynamically adjusting its capacity to handle the workload efficiently.
Lastly, monitoring the cluster-wide network metrics can provide insights into the overall network performance and identify any potential issues. Metrics such as network latency, packet loss, and throughput can help you pinpoint any network-related bottlenecks and optimize your network configurations accordingly.
In conclusion, while the basic metrics mentioned earlier are crucial for monitoring Kubernetes clusters, there are several additional metrics and indicators that can provide deeper insights into the performance, health, and scalability of your infrastructure. By monitoring these metrics, you can proactively identify and resolve issues, optimize resource allocation, and ensure the smooth operation of your applications in a Kubernetes environment.
Start monitoring your Kubernetes clusters with PerfectScale. Start your 30-day free trial here.
Automating Kubernetes monitoring
Manual monitoring can be tedious and time-consuming. Therefore, automating Kubernetes monitoring is crucial for managing large-scale environments efficiently. Automation allows you to collect metrics, generate reports, and trigger alerts effortlessly. It also enables more precise monitoring, as you can define thresholds and automate actions based on predefined rules and policies. Leveraging automation tools streamlines your monitoring processes, freeing up resources and enhancing overall system efficiency.
One of the key benefits of automating Kubernetes monitoring is the ability to collect metrics in real-time. With manual monitoring, you may only get periodic snapshots of your cluster's performance. However, by automating the process, you can continuously gather data on various aspects of your Kubernetes environment, such as CPU and memory usage, network traffic, and application performance. This real-time data allows you to identify and address issues promptly, ensuring optimal performance and availability.
Another advantage of automation is the ability to generate comprehensive reports effortlessly. With manual monitoring, creating reports can be a time-consuming task, requiring you to gather data from multiple sources and manually compile them into a presentable format. However, by automating the reporting process, you can generate detailed reports on various metrics and performance indicators with just a few clicks. These reports provide valuable insights into the health and performance of your Kubernetes cluster, helping you make informed decisions and identify areas for improvement.
Automation also plays a crucial role in triggering alerts and notifications. In a large-scale Kubernetes environment, it can be challenging to keep track of every potential issue manually. By automating the monitoring process, you can set up alerts and notifications based on predefined thresholds and rules. For example, you can configure alerts to trigger when CPU usage exceeds a certain threshold or when a specific application becomes unresponsive. These alerts can be sent via email, SMS, or integrated with popular collaboration tools like Slack, ensuring that you are promptly notified of any critical issues.
Moreover, automation tools allow you to define and enforce monitoring policies and rules consistently across your Kubernetes environment. With manual monitoring, it can be challenging to ensure that all teams and applications adhere to the same monitoring practices. However, by leveraging automation, you can define monitoring policies and rules that are automatically applied to all components of your Kubernetes cluster. This ensures that all applications and services are monitored consistently, reducing the risk of overlooking critical issues and improving overall system reliability.
By automating Kubernetes monitoring, you can also free up valuable resources within your organization. Manual monitoring often requires dedicated personnel to continuously monitor and analyze the cluster's performance. However, by automating these tasks, you can reallocate your resources to more strategic initiatives, such as optimizing application performance or developing new features. This not only improves operational efficiency but also allows your team to focus on higher-value activities that drive business growth.
Best Kubernetes Monitoring Tools and Solutions
When it comes to monitoring Kubernetes clusters, there are several tools and solutions available that cater to different monitoring requirements and preferences. These tools provide insights into the performance, stability, and scalability of your Kubernetes environment, allowing you to proactively identify and address any issues that may arise.
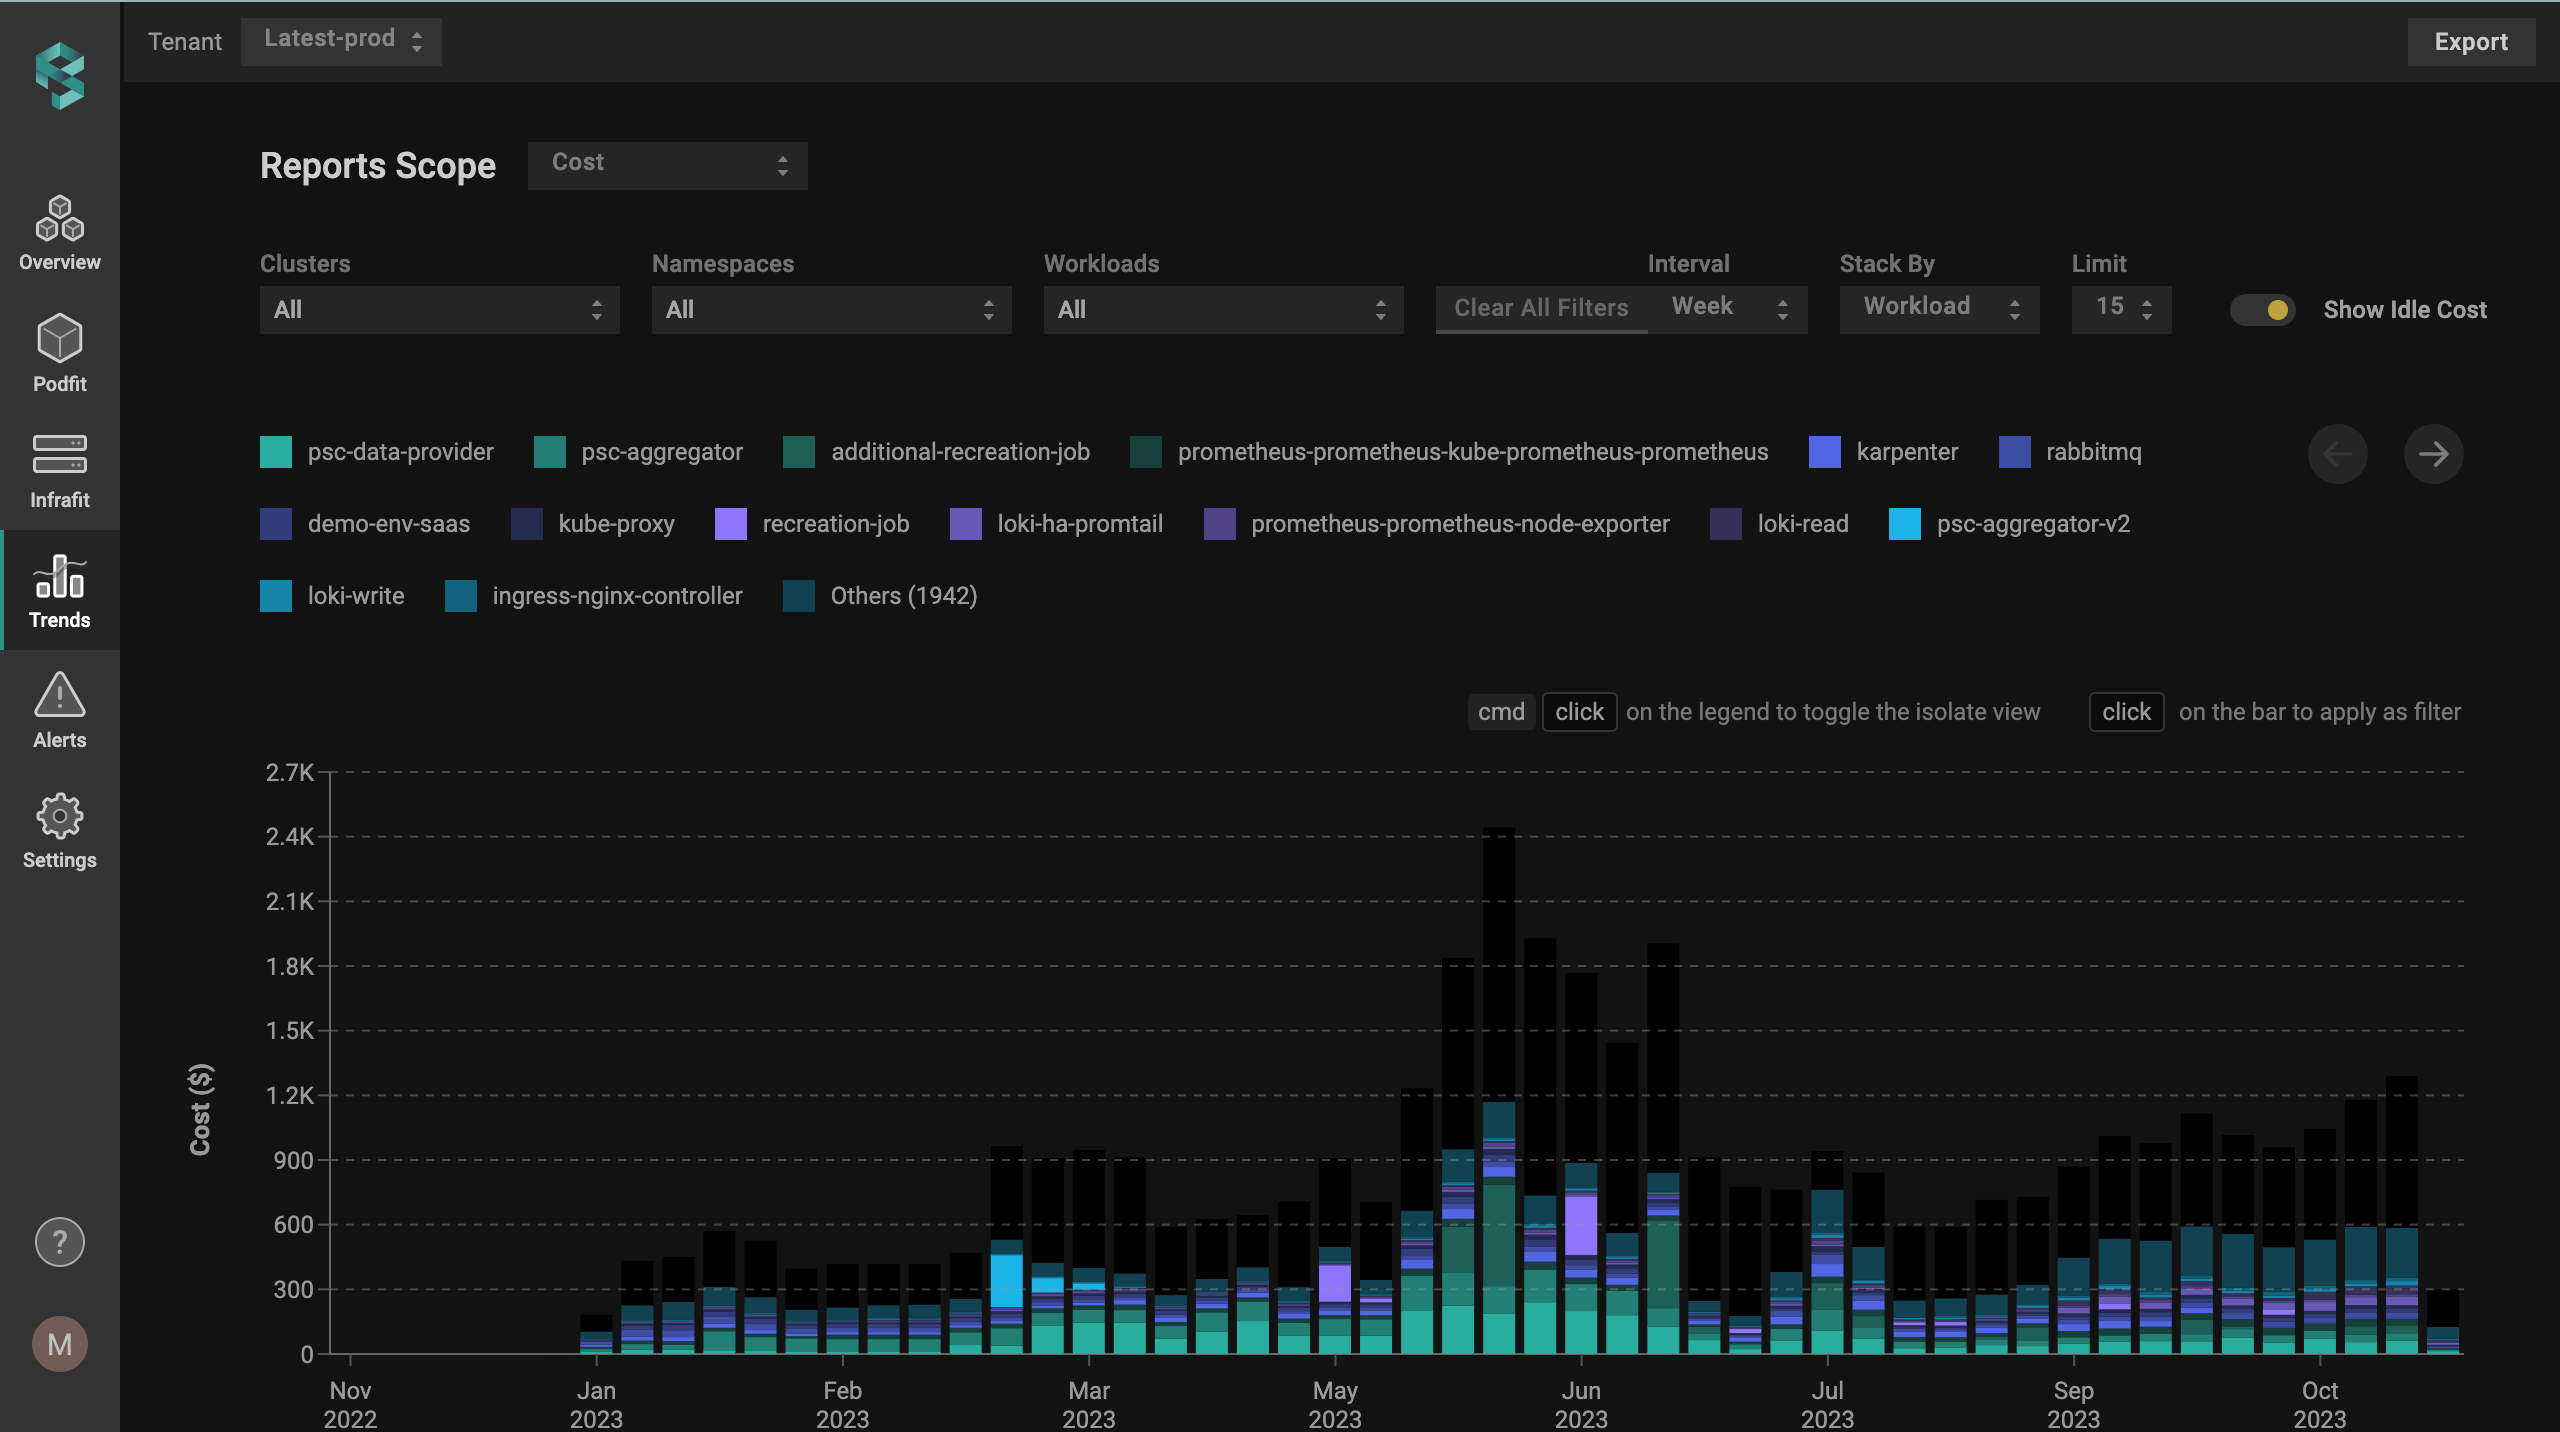
PerfectScale: Automated Cost Optimization and Kubernetes Monitoring Tool
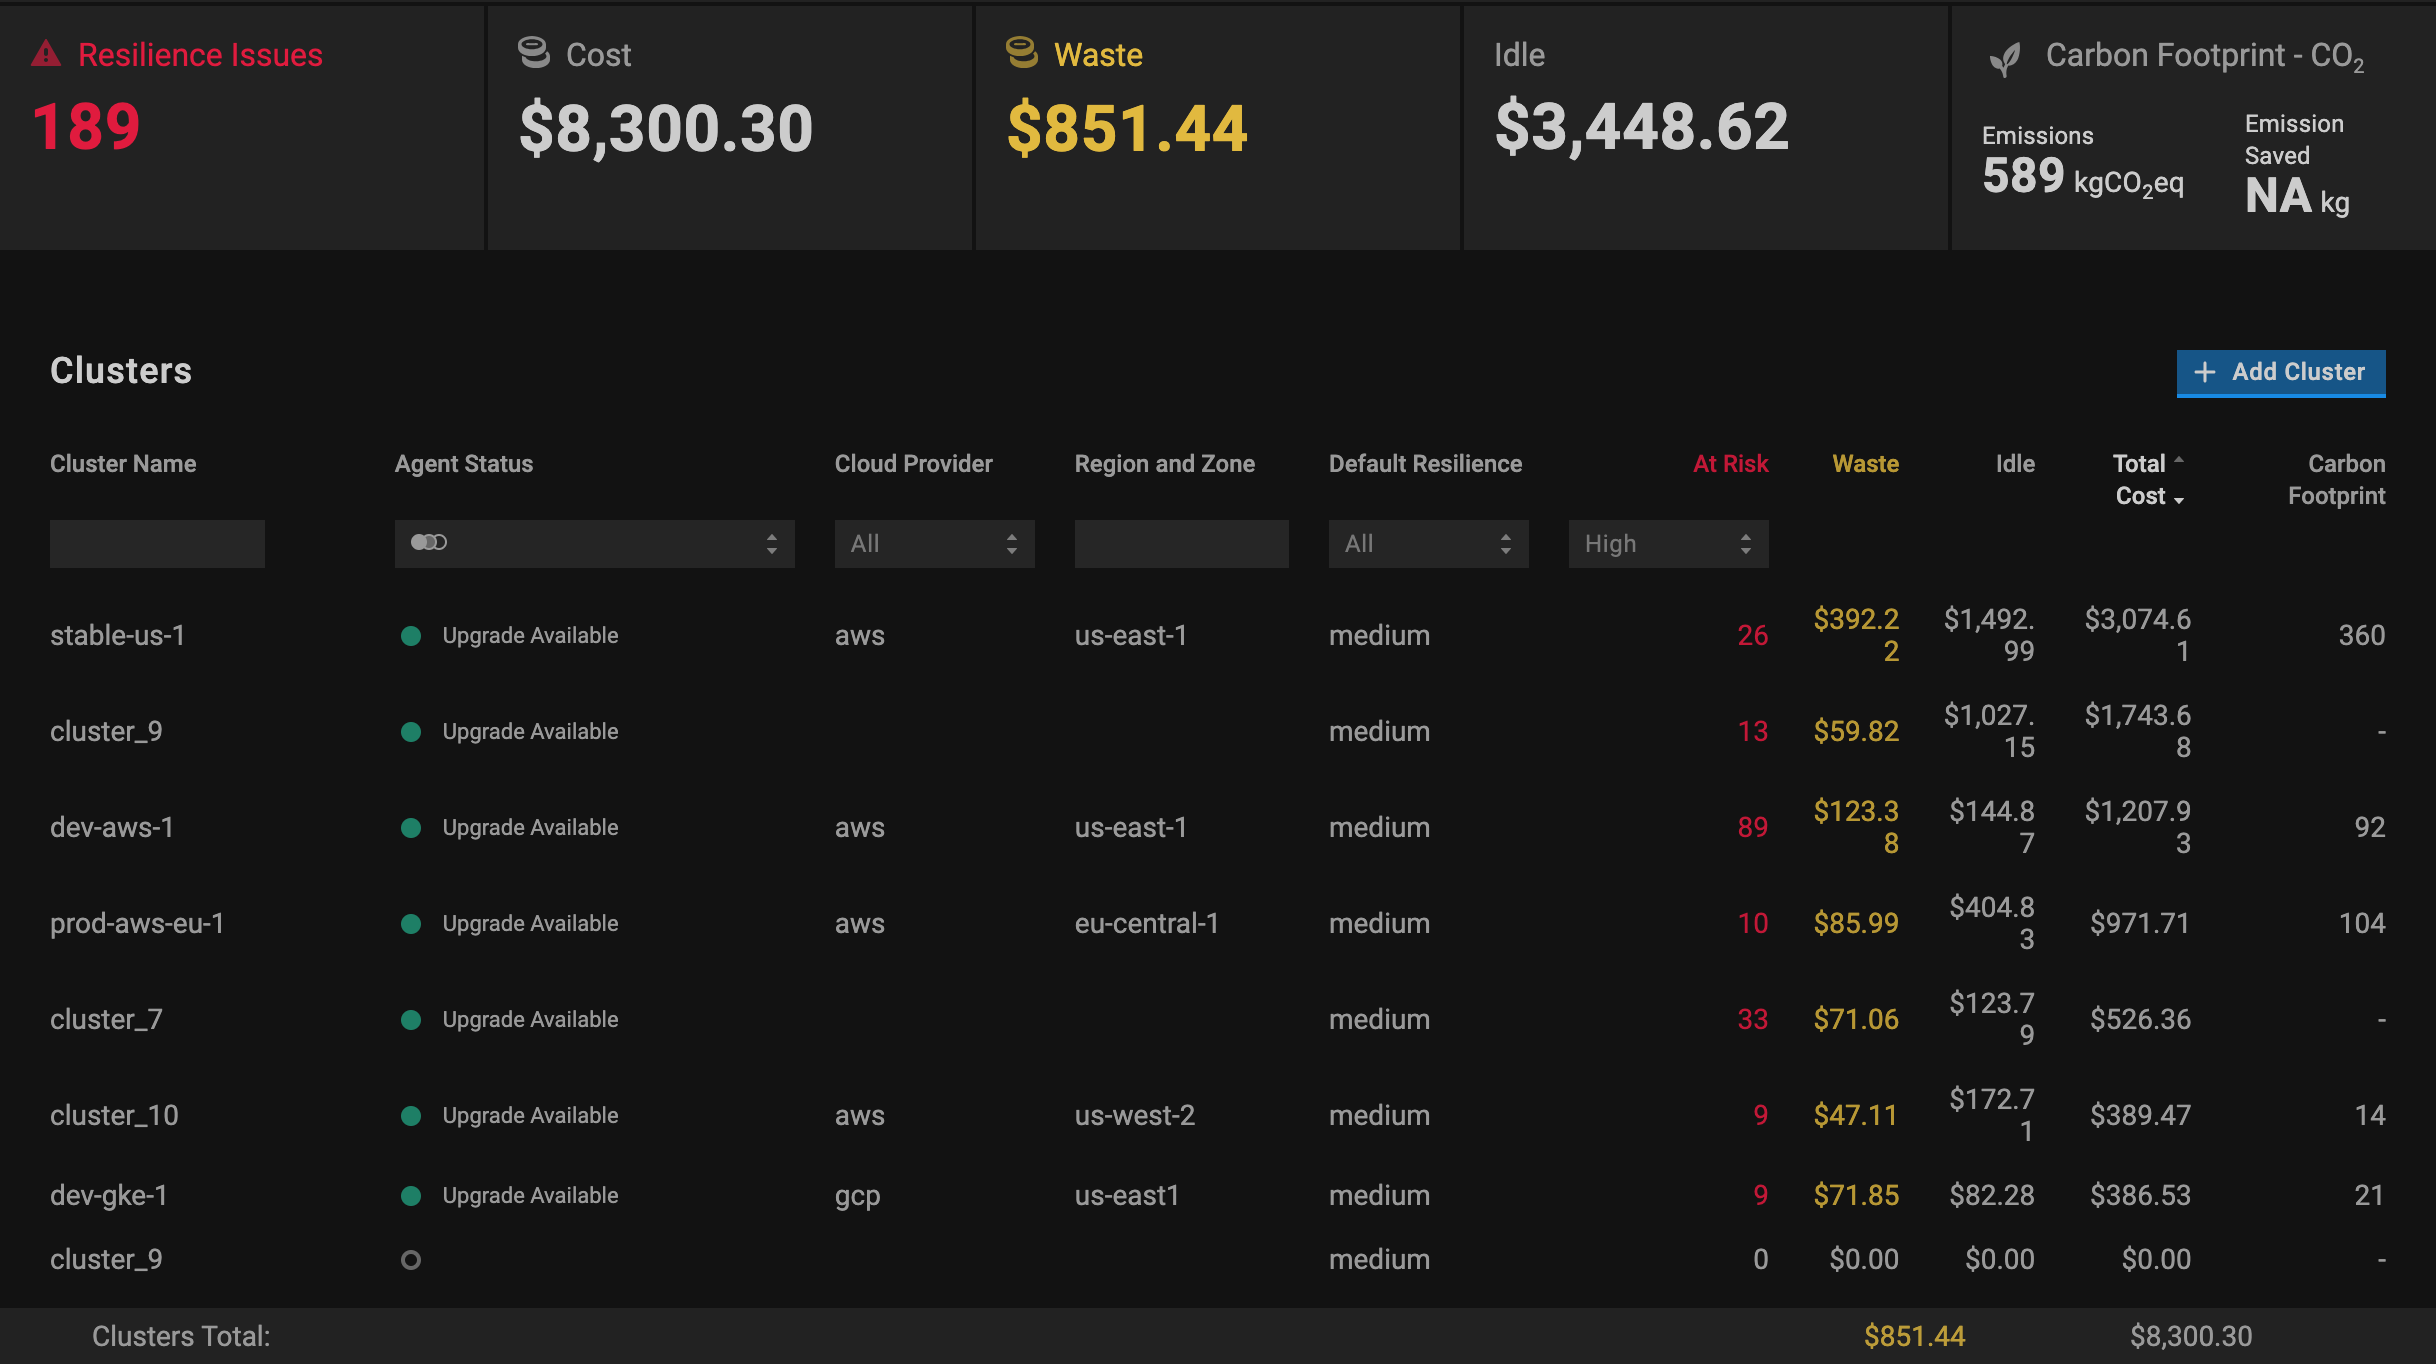
PerfectScale stands out as a unique, production-ready automation platform tailored for monitoring Kubernetes clusters. It is the only tool in the industry designed to autonomously and safely right-size your K8s setup, enhancing resilience, eliminating waste, and reducing carbon emissions. PerfectScale ensures that your Kubernetes environment remains scalable and optimized, effectively managing every aspect of your K8s stack.
Esteemed by leading DevOps teams from companies like Paramount Pictures and monday.com, PerfectScale is the go-to solution for K8s monitoring and performance optimization. Discover their success stories in these case studies.
Pros:
- Cloud and Kubernetes Compatibility: PerfectScale is universally compatible with various Kubernetes distributions and cloud platforms, including Kubernetes, Red Hat OpenShift, Rancher RKE, EKS, AKS, and GKE. It offers dynamic pricing integration for major cloud providers like AWS, GCP, and Azure.
- User-Friendly Interface: The intuitive UI of PerfectScale simplifies K8s optimization, offering environmental metrics and trends that are easily accessible to users of all experience levels.
- AI-Driven Cost Optimization: Leveraging K8s-specific AI algorithms, PerfectScale delivers accurate cost optimization by analyzing demand trends, configurations, and multiple parameters.
- Effective Prioritization: It cuts through observability alerting chaos, prioritizing issues by their impact on the environment for efficient issue resolution.
- Real-Time Alerts: PerfectScale provides comprehensive, configurable alerts for resilience risks and cost anomalies, integrating seamlessly with communication tools like Slack and Microsoft Teams.
- Seamless Workflow Integration: It natively integrates into application delivery processes, supporting both manual implementations via Jira tickets and autonomous actions directly in Kubernetes or through GitOps.
- Automated Optimization Actions: The platform autonomously executes actions to reduce costs and enhance environmental stability.
- Frictionless Monitoring and Operations: PerfectScale aligns various teams – DevOps, SREs, Platform Engineers, and FinOps – by providing essential data for informed decision-making and operational improvement.
- Carbon Emissions Monitoring: The tool offers insights into the carbon impact of your K8s environment and how optimization actions contribute to reducing your carbon footprint.
- Expert Support and Multi-Cluster Management: PerfectScale provides expert Kubernetes support and can manage multiple clusters, ideal for complex infrastructures.
Cons:
- Limited Availability: Currently, PerfectScale is offered only as a SaaS solution, with an on-prem version planned for 2024. It is not available on Google or Azure marketplaces, but can be purchased directly, through partners, or on the AWS marketplace.
Pricing:
Experience PerfectScale with a 30-day free trial and explore the benefits of this comprehensive K8s monitoring and cost optimization tool. Check PerfectScale pricing for more details.
Kubernetes Dashboard: – Native Kubernetes Monitoring Tool

The Kubernetes Dashboard is a web-based user interface designed for Kubernetes clusters. It offers an intuitive approach to managing, troubleshooting, and monitoring your Kubernetes environment. Through the Dashboard, you can access fundamental metrics, including memory and CPU usage, across all nodes. It also allows for monitoring the health of various workloads such as pods, deployments, replica sets, cron jobs, and more.
Prometheus - Open Source K8s Monitoring Tool
One popular K8s monitoring tool is Prometheus. It is a widely used open-source monitoring tool that provides powerful querying and alerting capabilities.
With Prometheus, you can collect and store time-series data, allowing you to analyze and visualize the metrics of your Kubernetes clusters. Its flexible query language, PromQL, enables you to gain deep insights into your system's behavior and performance.
Grafana - Open Source Visualization Tool

Another tool that seamlessly integrates with Prometheus is Grafana. Grafana is an open-source visualization tool that allows you to create beautiful and interactive dashboards. With Grafana, you can easily visualize the metrics collected by Prometheus and other monitoring systems. Its rich set of plugins and community-driven dashboards make it a popular choice for Kubernetes monitoring.
DataDog - Cloud-native Monitoring Tool
If you are looking for a cloud-native monitoring platform, Datadog is worth considering. Datadog offers comprehensive monitoring and analytics features specifically designed for Kubernetes environments. It provides real-time visibility into the health and performance of your clusters, allowing you to detect and troubleshoot issues quickly.
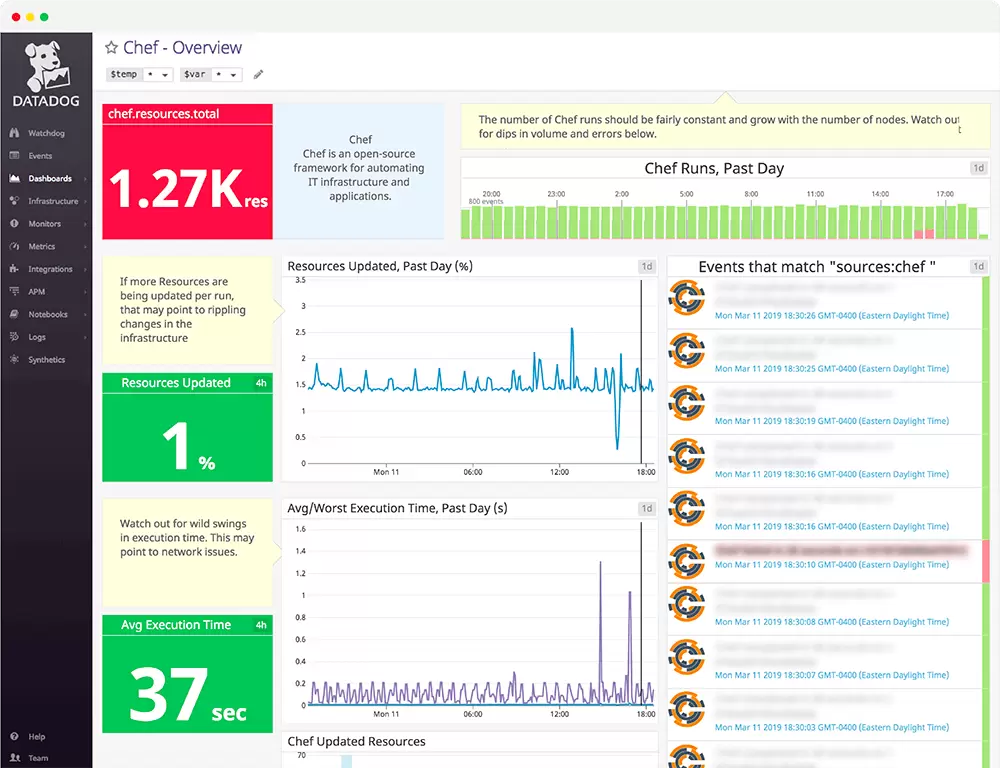
With its built-in machine learning capabilities, Datadog can even help you identify anomalies and predict potential problems before they impact your applications.
ELK Stack (Elasticsearch, Logstash, and Kibana) - Kubernetes Analysis Solution

For those who want to focus on log analysis, the ELK Stack (Elasticsearch, Logstash, and Kibana) is a powerful combination. Elasticsearch is a distributed search and analytics engine that can be used to store and index Kubernetes logs and metrics. Logstash, on the other hand, is a data processing pipeline that allows you to collect, transform, and enrich your log data before sending it to Elasticsearch. Finally, Kibana provides a user-friendly interface for visualizing and exploring the data stored in Elasticsearch.
Together, these tools form a robust solution for log analysis in Kubernetes environments.
Kubewatch - Event-based Monitoring Tool for Kubernetes Clusters
Kubewatch is a Kubernetes event watcher that specializes in providing real-time, event-based monitoring for Kubernetes clusters. The tool is engineered to work seamlessly with Kubernetes APIs, offering in-depth visibility into changes within the cluster. This includes updates to deployments, pods, and nodes. Kubewatch actively listens for events generated by the Kubernetes API and promptly sends notifications to administrators. This feature allows administrators to stay informed of any changes as they happen, enabling them to respond quickly and effectively to potential issues within the Kubernetes environment.
Sematext – Full-Stack Kubernetes monitoring Tool
Sematext K8s monitoring provides a versatile solution for monitoring both traditional and microservice-based applications on Kubernetes. It efficiently captures real-time metrics and events, allowing you to organize, visualize, and scrutinize the data. With customizable alerts and notifications, you can focus on the metrics that are crucial for your operations.

Getting started with Sematext is straightforward. The Sematext Agent, necessary for implementation, is easily installable as a Helm chart, DaemonSet, or Kubernetes Operator, with simple copy-paste setup commands.
With Sematext Discovery, you can:
- Automatically discover and monitor your containerized applications.
- Directly set up performance and log monitoring from the user interface, without additional installations.
- Effortlessly adapt to scaling services or shifting across containers and hosts, as Discovery automatically monitors containerized applications upon activation.
Jaeger - Open-Source Tracing and Monitoring Tool
Jaeger, an open-source tracing tool initially developed by Uber Technologies and released in 2016, is designed for monitoring and troubleshooting within complex distributed systems, such as those in Kubernetes environments.

It enables users to conduct detailed root cause analysis, monitor distributed transactions, manage distributed context propagations, analyze service dependencies, and optimize performance and latency.
Supporting OpenTelemetry, Jaeger is compatible with a variety of programming languages, including Java, Node, Python, Go, and C++. It also integrates with multiple data sources like Cassandra, Elasticsearch, Kafka, and in-memory databases. Further information on using Jaeger for distributed tracing is available for those interested.
New Relic - K8s Monitoring and Tracking Tool
New Relic offers a monitoring solution with robust Kubernetes integration, providing a comprehensive view of your servers, hosts, applications, and services. This tool enables the capture of both data and metadata for various Kubernetes components, including nodes, pods, containers, deployments, replica sets, and namespaces. It is equipped with advanced search features, along with tag-based alerting and dashboard capabilities.
The platform includes a cluster explorer, presenting a multi-dimensional visualization of a Kubernetes cluster. This feature allows for in-depth exploration of Kubernetes data and metadata through pre-built dashboards. Teams can leverage the cluster explorer to swiftly identify and resolve issues such as failures, bottlenecks, and other irregularities within their Kubernetes environments.
Best Kubernetes Monitoring Tool for your Business
In conclusion, Kubernetes monitoring tools play a vital role in maintaining the performance, stability, and scalability of your Kubernetes clusters.
PerfectScale offers an all-encompassing solution suitable for any organization size, aiming to monitor K8s cluster and reduce cloud costs without compromising performance. Leveraging advanced algorithms and machine learning, it ensures services are optimally resourced to meet demand efficiently.
PerfectScale K8s monitoring tool automates the right-sizing and scaling of resources in Kubernetes, adapting to changing environments to minimize waste and enhance stability. By easing the Kubernetes optimization workload for DevOps, Platform, SRE, and FinOps teams, PerfectScale allows them to concentrate on more critical tasks, ensuring cost-effective, reliable, and stable Kubernetes operations.
Easy to implement with immediate results, PerfectScale is an ideal solution for monitoring K8s and lowering Kubernetes costs while prioritizing system uptime and resilience. Start your free 30-day trial now.